
LoveMyVouchers.co.uk have carried out the most in depth study yet into food hygiene ratings for restaurants and cafes in the United Kingdom.
In order to find out which areas of the country are doing the best when it comes to meeting the health and safety standards set out by the Food Standards Agency (FSA), we looked at the ratings that businesses have been awarded through the inspections carried out by local authorities under the Food Hygiene Rating Scheme.
The statistics have revealed some very interesting results, so if you want to find out how your home town has fared, check out the table below.
Please note, the results are for the whole of the UK excluding Scotland, as they have a different rating system. Scotland results have been analysed separately. Pubs that serve food are not included in this part of the study, and have also been analysed separately.
Key Findings
- The London Boroughs performed worse than any other area, with Ealing, Newham, and Harrow being the worst overall. Newham and Ealing have the first and second highest proportion of 0, 1 and 2 ratings, and Harrow has the lowest percentage of 4 and 5 ratings.
- In England, outside of London, the worst performing areas are Hertsmere, Birmingham and Hyndburn. Birmingham has the highest percentage of zero ratings, and a high proportion of 0, 1 and 2 ratings.
- Out of the London Boroughs, England, Northern Ireland and Wales, Northern Ireland performed the best, with no zero ratings, a low proportion of 0, 1 and 2 ratings, and a high proportion of 5 ratings. The top 25 council districts with the highest percentage of restaurants rated good or very good (4 or 5), however, were all in England.
- The council district that performed the best overall was South Derbyshire, with the highest proportion of restaurants rated good (4) or very good (5), and no restaurants rated 0, 1 or 2. Darlington, also performed very well, with no 1 or 2 ratings, the highest percentage of 5 ratings, and a very high proportion of 4 and 5 ratings.
Council Districts with the Worst Food Hygiene Ratings
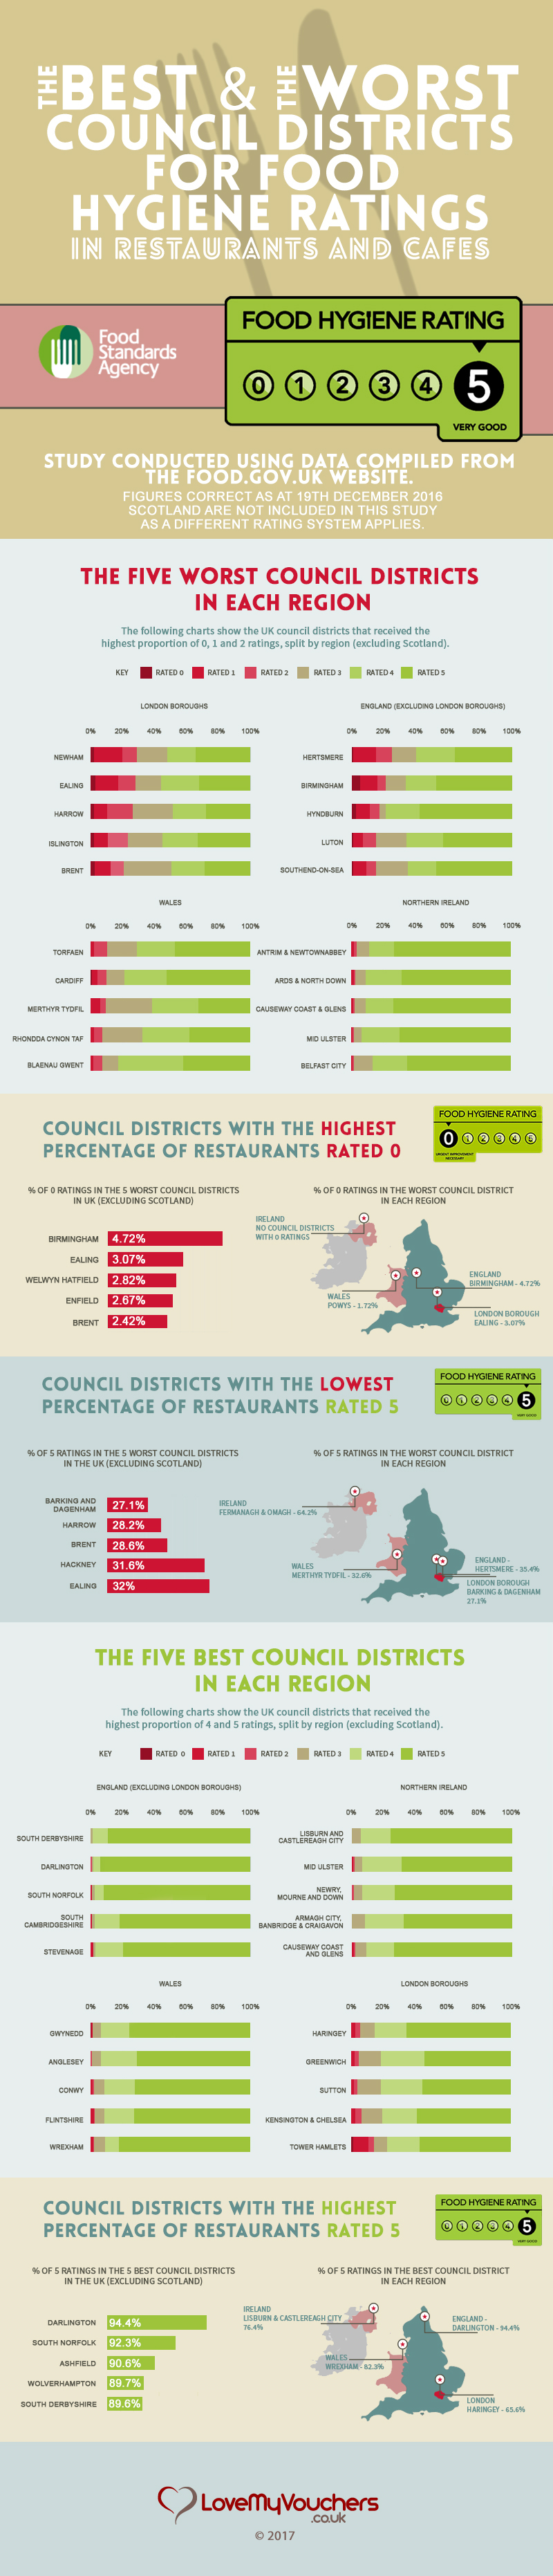
Birmingham has the most restaurants and cafes with a zero hygiene rating from the Food Standards Agency. Of the 1249 eateries in the area, 4.7% were given the lowest possible rating for hygiene standards.
Other areas with a high percentage of zero rated restaurants include Ealing (3.1%), Welwyn Hatfield (2.8%), Enfield (2.7%) and Brent (2.4%).
Ealing also has the second highest percentage of restaurants and cafes rated between 0 and 2 (28.2%). Newham is worst with 29.2%, Harrow fourth with 26.2%, and Hertsmere fifth with 24.6%.
Barking and Dagenham has the lowest percentage of eateries given top marks with just 27.1% out of 177 premises in total.
Other areas which have a low percentage of businesses awarded 5 include Harrow (28.2%), Brent (28.6%), Hackney (31.6%) and Ealing (32%).
Less than half of the restaurants and cafes in Harrow scored 4 or 5, at just 48.2%. Brent, Newham, Islington and Ealing were also in the bottom five in this category, with 49.1%, 52%, 55.1%, and 56% respectively. All five districts are London Boroughs.
Hertsmere was the worst district outside of London for restaurants achieving 4 or 5, with 60% of restaurants and cafes being awarded the top scores.
Torfaen was the worst district in Wales. Although no restaurants have a rating of zero, 10% of restaurants have been given poor ratings of 1 or 2. Cardiff followed closely behind, with 9.7% of its restaurants and cafes having been awarded a rating of 0, 1 or 2.
Only 61.6% of restaurants in Merthyr Tydfil have a good or very good rating of 4 or 5 – the lowest percentage in Wales. Other districts with a low percentage of 4 or 5 ratings in Wales include Rhondda Cynon Taf with 67.7%, and Vale of Glamorgan with 69.8%.
The worst district in Ireland was Antrim and Newtownabbey, although only 3.3% of the restaurants and cafes were rated 2 or below (ranked 234 out of the 360 council districts included in the study), and it did not get any zero ratings. It also got a respectable 89.2% of 4 and 5 ratings.
Council Districts with the Best Food Hygiene Ratings
The area which fared best is South Derbyshire. With 106 applicable businesses, 99.1% are rated good (4) or very good (5). 98.8% of Darlington’s 161 restaurants and cafes had a rating of 4 or 5. Other areas with a high percentage of restaurants scoring 4 or above include South Norfolk (97.7%), South Cambridgeshire, (97.7%) and Stevenage (97.3%).
Darlington has the highest percentage of restaurants with the top rating of 5, at 94.4%, and it also has no ratings of 0 or 1.
Other areas with a high percentage of restaurants with 5/5 for hygiene include South Norfolk (92.3%), Ashfield (90.6%), Wolverhampton (89.7%) and South Derbyshire (89.7%).
229 districts have no restaurants with a zero rating, with examples including Rotherham, Harlow and the Isle of Wight. Ten districts did not have any 0, 1 or 2 ratings, including South Derbyshire, Christchurch, Melton, and Newcastle-Under-Lyme.
Northern Ireland is the best place to visit for hygienic cafes and restaurants, with no zero ratings; all districts having less than 4% rated as 2 or 1; and all districts having more than 86% of their restaurants and cafes rated as 4 or 5. Three of the ten districts that did not receive any 0, 1 or 2 ratings were from Northern Ireland.
The best regions in Wales were Gwynedd and Anglesea, both of which have 94% of restaurants with a rating of 4 or 5, and less than 1.1% of restaurants and cafes with a rating of 2 or less.
The best London borough is Sutton, with no zero ratings and just 4% of restaurants and cafes awarded a rating of 2 or less. 81.09% of applicable businesses received a 4 or 5 rating.
Restaurants and Cafes In England, Wales and Northern Ireland
The following data is from the Food Standards Agency website, food.gov.uk, and is correct as at 19th December 2016.
| Council Area | Total Number of Businesses | % Rated 0 | % Rated 1 | % Rated 2 | % Rated 3 | % Rated 4 | % Rated 5 | % Rated 0,1 & 2 |
% Rated 4 & 5 |
|---|---|---|---|---|---|---|---|---|---|
|
Newham
|
377 | 2.39 | 17.51 | 9.28 | 18.83 | 17.77 | 34.22 | 29.18 | 51.99 |
| Ealing | 554 | 3.07 | 14.26 | 10.83 | 15.88 | 24.01 | 31.95 | 28.16 | 55.96 |
|
Harrow
|
309 | 1.94 | 8.41 | 15.86 | 25.57 | 20.06 | 28.16 | 26.21 | 48.22 |
| Hertsmere | 195 | 0.51 | 14.36 | 9.74 | 15.38 | 24.62 | 35.38 | 24.61 | 60 |
|
Islington
|
829 | 1.93 | 9.05 | 12.55 | 21.35 | 22.32 | 32.81 | 23.53 | 55.13 |
| Birmingham | 1249 | 4.72 | 10.89 | 5.92 | 12.25 | 18.9 | 47.32 | 21.53 | 66.22 |
| Brent | 454 | 2.42 | 10.35 | 8.15 | 29.96 | 20.48 | 28.63 | 20.92 | 49.11 |
|
Enfield
|
374 | 2.67 | 10.16 | 6.68 | 20.59 | 21.39 | 38.5 | 19.51 | 59.89 |
|
Hackney
|
681 | 0.59 | 7.78 | 10.57 | 22.17 | 27.31 | 31.57 | 18.94 | 58.88 |
|
Lewisham
|
613 | 0.82 | 7.18 | 10.11 | 23.49 | 22.02 | 36.38 | 18.11 | 58.4 |
| Hyndburn | 98 | 2.04 | 9.18 | 6.12 | 4.08 | 20.41 | 58.16 | 17.34 | 78.57 |
|
Havering
|
490 | 0.41 | 9.59 | 7.14 | 17.96 | 19.59 | 45.31 | 17.14 | 64.9 |
| Westminster | 2696 | 1.15 | 5.6 | 8.68 | 12.2 | 24.55 | 47.81 | 15.43 | 72.36 |
| Luton | 208 | 0.96 | 5.77 | 8.65 | 18.75 | 23.08 | 42.79 | 15.38 | 65.87 |
| Southend-On-Sea | 395 | 0.76 | 8.1 | 6.08 | 20 | 17.72 | 47.34 | 14.94 | 65.06 |
| Barnet | 447 | 1.79 | 6.71 | 6.04 | 15.66 | 25.06 | 44.74 | 14.54 | 69.8 |
|
Croydon
|
428 | 0.93 | 9.35 | 3.97 | 20.09 | 25.47 | 40.19 | 14.25 | 65.66 |
|
Barking and Dagenham
|
177 | 0 | 6.21 | 7.91 | 25.42 | 33.33 | 27.12 | 14.12 | 60.45 |
| Tower Hamlets | 1841 | 1.09 | 9.51 | 3.31 | 8.64 | 20.26 | 57.2 | 13.91 | 77.46 |
| Hounslow | 389 | 1.03 | 6.68 | 6.17 | 16.45 | 22.88 | 46.79 | 13.88 | 69.67 |
| Kingston-Upon-Thames | 317 | 0.95 | 6.62 | 6.31 | 16.09 | 17.03 | 53 | 13.88 | 70.03 |
|
Bromley
|
442 | 0.9 | 8.6 | 4.3 | 21.49 | 25.11 | 39.59 | 13.8 | 64.7 |
| Leicester City | 492 | 0.61 | 6.1 | 6.91 | 16.46 | 17.89 | 52.03 | 13.62 | 69.92 |
| Isle of Wight | 331 | 1.51 | 3.93 | 7.85 | 9.97 | 21.75 | 54.98 | 13.29 | 76.73 |
| Slough | 151 | 0 | 8.61 | 4.64 | 16.56 | 21.85 | 48.34 | 13.25 | 70.19 |
| North Hertfordshire | 183 | 1.09 | 9.29 | 2.73 | 6.01 | 22.4 | 58.47 | 13.11 | 80.87 |
| Wycombe | 178 | 1.69 | 5.62 | 5.62 | 9.55 | 14.04 | 63.48 | 12.93 | 77.52 |
| Epsom and Ewell | 174 | 1.15 | 6.32 | 5.17 | 12.07 | 21.84 | 53.45 | 12.64 | 75.29 |
|
Camden
|
1210 | 1.07 | 6.86 | 4.71 | 22.31 | 22.89 | 42.15 | 12.64 | 65.04 |
| Wandsworth | 584 | 0.34 | 5.48 | 6.51 | 14.21 | 27.23 | 46.23 | 12.33 | 73.46 |
| Trafford | 413 | 0 | 5.08 | 7.02 | 17.19 | 19.85 | 50.85 | 12.1 | 70.7 |
| Walsall | 232 | 1.29 | 4.74 | 6.03 | 25 | 18.1 | 44.83 | 12.06 | 62.93 |
| North Lincolnshire | 192 | 0.52 | 5.73 | 5.73 | 10.94 | 19.27 | 57.81 | 11.98 | 77.08 |
| Hillingdon | 488 | 0.61 | 5.94 | 5.33 | 14.34 | 19.88 | 53.89 | 11.88 | 73.77 |
| Spelthorne | 145 | 0.69 | 6.21 | 4.83 | 8.97 | 25.52 | 53.79 | 11.73 | 79.31 |
| Vale of White Horse | 156 | 0 | 3.85 | 7.69 | 11.54 | 23.72 | 53.21 | 11.54 | 76.93 |
| Manchester | 1163 | 0.34 | 9.37 | 1.81 | 8.34 | 17.71 | 62.42 | 11.52 | 80.13 |
| Welwyn Hatfield | 177 | 2.82 | 3.39 | 5.08 | 10.17 | 20.9 | 57.63 | 11.29 | 78.53 |
| Richmond-Upon-Thames | 419 | 1.43 | 6.92 | 2.86 | 21.24 | 24.11 | 43.44 | 11.21 | 67.55 |
|
Waltham Forest
|
396 | 0.51 | 1.77 | 8.59 | 23.48 | 23.23 | 42.42 | 10.87 | 65.65 |
| Lambeth | 660 | 0.15 | 8.18 | 2.42 | 18.18 | 29.85 | 41.21 | 10.75 | 71.06 |
| Southwark | 807 | 0.5 | 3.1 | 7.06 | 18.84 | 23.79 | 46.72 | 10.66 | 70.51 |
| York | 415 | 0 | 5.06 | 5.54 | 10.84 | 23.61 | 54.94 | 10.6 | 78.55 |
| Calderdale | 350 | 1.43 | 2.57 | 6.57 | 11.43 | 26.29 | 51.71 | 10.57 | 78 |
| Fareham | 114 | 0.88 | 3.51 | 6.14 | 11.4 | 14.04 | 64.04 | 10.53 | 78.08 |
| Sandwell | 243 | 0 | 5.76 | 4.53 | 12.35 | 20.99 | 56.38 | 10.29 | 77.37 |
| South Oxfordshire | 107 | 0.93 | 3.74 | 5.61 | 12.15 | 27.1 | 50.47 | 10.28 | 77.57 |
| Liverpool | 826 | 0.61 | 4.72 | 4.84 | 14.65 | 22.76 | 52.42 | 10.17 | 75.18 |
| East Hertfordshire | 179 | 0 | 5.03 | 5.03 | 7.82 | 27.37 | 54.75 | 10.06 | 82.12 |
| Torfaen | 100 | 0 | 2 | 8 | 19 | 24 | 47 | 10 | 71 |
| Redbridge | 357 | 1.12 | 2.52 | 6.16 | 13.73 | 15.97 | 60.5 | 9.8 | 76.47 |
| Bolton | 391 | 0.51 | 4.09 | 5.12 | 19.18 | 34.78 | 36.32 | 9.72 | 71.1 |
| Cardiff | 765 | 0.39 | 3.66 | 5.62 | 11.76 | 26.14 | 52.42 | 9.67 | 78.56 |
| Watford | 166 | 0.6 | 5.42 | 3.61 | 8.43 | 18.67 | 63.25 | 9.63 | 81.92 |
| Coventry | 367 | 0.27 | 4.36 | 4.9 | 7.63 | 12.81 | 70.03 | 9.53 | 82.84 |
| North Somerset | 255 | 0.39 | 5.88 | 3.14 | 12.55 | 22.75 | 55.29 | 9.41 | 78.04 |
| Bracknell Forest | 117 | 0.85 | 4.27 | 4.27 | 11.97 | 20.51 | 58.12 | 9.39 | 78.63 |
| Merthyr Tydfil | 86 | 0 | 5.81 | 3.49 | 29.07 | 29.07 | 32.56 | 9.3 | 61.63 |
| Hull City | 384 | 0.52 | 4.69 | 3.65 | 15.89 | 22.14 | 53.13 | 8.86 | 75.27 |
| Fylde | 136 | 0.74 | 1.47 | 6.62 | 5.88 | 29.41 | 55.88 | 8.83 | 85.29 |
| St Albans City | 195 | 1.03 | 3.08 | 4.62 | 17.44 | 22.56 | 51.28 | 8.73 | 73.84 |
| Blackburn | 149 | 0 | 2.68 | 6.04 | 8.05 | 20.13 | 63.09 | 8.72 | 83.22 |
| Kirklees | 471 | 0.64 | 2.97 | 5.1 | 10.62 | 19.53 | 61.15 | 8.71 | 80.68 |
| Sevenoaks | 138 | 0.72 | 2.17 | 5.8 | 18.12 | 31.16 | 42.03 | 8.69 | 73.19 |
| Chorley | 104 | 0 | 5.77 | 2.88 | 4.81 | 15.38 | 71.15 | 8.65 | 86.53 |
| Rochdale | 187 | 0 | 3.21 | 5.35 | 13.37 | 25.67 | 52.41 | 8.56 | 78.08 |
| Bradford | 628 | 0 | 4.78 | 3.66 | 11.46 | 19.9 | 60.19 | 8.44 | 80.09 |
| Rugby | 132 | 1.52 | 5.3 | 1.52 | 6.82 | 12.88 | 71.97 | 8.34 | 84.85 |
| Swindon | 300 | 0.67 | 3.67 | 4 | 12 | 21 | 58.67 | 8.34 | 79.67 |
| Barrow-in-Furness | 73 | 0 | 6.85 | 1.37 | 1.37 | 10.96 | 79.45 | 8.22 | 90.41 |
| Dacorum | 220 | 0 | 5 | 3.18 | 10.91 | 16.36 | 64.55 | 8.18 | 80.91 |
| Breckland | 160 | 0 | 5 | 3.13 | 15 | 20.63 | 56.25 | 8.13 | 76.88 |
| Tamworth | 74 | 0 | 2.7 | 5.41 | 8.11 | 10.81 | 72.97 | 8.11 | 83.78 |
| North Warwickshire | 99 | 0 | 4.04 | 4.04 | 14.14 | 22.22 | 55.56 | 8.08 | 77.78 |
| Merton | 285 | 0.35 | 2.81 | 4.91 | 20.35 | 38.95 | 32.63 | 8.07 | 71.58 |
| Dudley | 349 | 0.29 | 4.3 | 3.44 | 14.61 | 22.92 | 54.44 | 8.03 | 77.36 |
| Oxford City | 378 | 0.53 | 2.12 | 5.29 | 11.9 | 15.61 | 64.55 | 7.94 | 80.16 |
| Barnsley | 233 | 0.43 | 3.43 | 3.86 | 6.44 | 14.16 | 71.67 | 7.72 | 85.83 |
| Portsmouth | 355 | 0.56 | 3.66 | 3.38 | 11.83 | 19.44 | 61.13 | 7.6 | 80.57 |
| New Forest | 224 | 0 | 5.8 | 1.79 | 9.82 | 26.34 | 56.25 | 7.59 | 82.59 |
| Bedford | 227 | 0.44 | 1.76 | 5.29 | 4.85 | 23.79 | 63.88 | 7.49 | 87.67 |
| Reigate and Banstead | 187 | 0 | 3.74 | 3.74 | 11.23 | 16.04 | 65.24 | 7.48 | 81.28 |
| Stockport | 552 | 0 | 4.53 | 2.9 | 16.12 | 24.09 | 52.36 | 7.43 | 76.45 |
| Mole Valley | 149 | 0 | 6.71 | 0.67 | 11.41 | 16.78 | 64.43 | 7.38 | 81.21 |
| Wellingborough | 69 | 0 | 1.45 | 5.8 | 18.84 | 14.49 | 59.42 | 7.25 | 73.91 |
| Rhondda Cynon Taf | 291 | 0 | 2.06 | 5.15 | 25.09 | 29.55 | 38.14 | 7.21 | 67.69 |
| Waverley | 181 | 0.55 | 2.76 | 3.87 | 9.39 | 27.07 | 56.35 | 7.18 | 83.42 |
| Peterborough City | 254 | 0.79 | 1.18 | 5.12 | 5.91 | 15.35 | 71.65 | 7.09 | 87 |
| East Devon | 255 | 0 | 2.35 | 4.71 | 16.08 | 20.39 | 56.47 | 7.06 | 76.86 |
|
Hammersmith and Fulham
|
630 | 0.16 | 3.65 | 3.17 | 19.37 | 21.27 | 52.38 | 6.98 | 73.65 |
| Great Yarmouth | 231 | 0 | 3.03 | 3.9 | 6.93 | 25.97 | 60.17 | 6.93 | 86.14 |
| Mansfield | 116 | 0 | 1.72 | 5.17 | 7.76 | 25.86 | 59.48 | 6.89 | 85.34 |
| Blaenau Gwent | 58 | 0 | 1.72 | 5.17 | 10.34 | 41.38 | 41.38 | 6.89 | 82.76 |
| Lancaster City | 233 | 0 | 3.86 | 3 | 8.15 | 18.03 | 66.95 | 6.86 | 84.98 |
| Aylesbury Vale | 204 | 0 | 0.98 | 5.88 | 13.24 | 24.02 | 55.88 | 6.86 | 79.9 |
| Rotherham | 313 | 0 | 4.79 | 1.92 | 8.63 | 13.42 | 71.25 | 6.71 | 84.67 |
| Salford | 358 | 0.28 | 3.63 | 2.79 | 12.29 | 21.23 | 59.78 | 6.7 | 81.01 |
| Monmouthshire | 180 | 0.56 | 2.22 | 3.89 | 17.78 | 25 | 50.56 | 6.67 | 75.56 |
| Uttlesford | 225 | 0.44 | 4 | 2.22 | 5.78 | 11.56 | 76 | 6.66 | 87.56 |
|
City of London Corporation
|
781 | 0.38 | 2.69 | 3.59 | 6.66 | 15.88 | 70.81 | 6.66 | 86.69 |
| Wirral | 512 | 0.98 | 1.76 | 3.91 | 13.67 | 21.09 | 58.59 | 6.65 | 79.68 |
| Wiltshire | 548 | 0 | 3.28 | 3.28 | 10.4 | 18.8 | 64.23 | 6.56 | 83.03 |
| Kensington and Chelsea | 774 | 0.13 | 2.45 | 3.88 | 13.05 | 21.58 | 58.91 | 6.46 | 80.49 |
| Pembrokeshire | 341 | 0 | 4.4 | 2.05 | 5.57 | 14.96 | 73.02 | 6.45 | 87.98 |
| Adur | 62 | 0 | 4.84 | 1.61 | 9.68 | 25.81 | 58.06 | 6.45 | 83.87 |
| Wigan | 636 | 0 | 2.2 | 4.25 | 26.89 | 29.25 | 37.42 | 6.45 | 66.67 |
| Ryedale | 141 | 0.71 | 2.84 | 2.84 | 6.38 | 13.48 | 73.76 | 6.39 | 87.24 |
| Huntingdonshire | 222 | 0.45 | 3.15 | 2.7 | 11.26 | 18.02 | 64.41 | 6.3 | 82.43 |
| Bridgend | 191 | 0 | 1.57 | 4.71 | 17.8 | 29.32 | 46.6 | 6.28 | 75.92 |
| Newport | 255 | 1.57 | 2.35 | 2.35 | 9.02 | 22.75 | 61.96 | 6.27 | 84.71 |
| Castle Point | 80 | 0 | 2.5 | 3.75 | 15 | 13.75 | 65 | 6.25 | 78.75 |
| Ceredigion | 180 | 0.56 | 1.67 | 3.89 | 8.33 | 17.22 | 68.33 | 6.12 | 85.55 |
| Preston | 197 | 0 | 1.52 | 4.57 | 12.69 | 20.3 | 60.91 | 6.09 | 81.21 |
| Waveney | 230 | 0 | 3.04 | 3.04 | 6.96 | 20.87 | 66.09 | 6.08 | 86.96 |
| Shepway | 231 | 0 | 0 | 6.06 | 14.29 | 14.29 | 65.37 | 6.06 | 79.66 |
| North Tyneside | 200 | 0 | 2.5 | 3.5 | 7 | 22.5 | 64.5 | 6 | 87 |
| South Buckinghamshire | 50 | 0 | 4 | 2 | 8 | 22 | 64 | 6 | 86 |
| Taunton Deane | 184 | 0 | 3.26 | 2.72 | 4.89 | 17.93 | 71.2 | 5.98 | 89.13 |
| Arun | 218 | 0 | 1.83 | 4.13 | 10.55 | 24.77 | 58.72 | 5.96 | 83.49 |
|
Telford and Wrekin Council
|
219 | 1.83 | 3.2 | 0.91 | 7.76 | 14.61 | 71.69 | 5.94 | 86.3 |
| West Berkshire | 101 | 0 | 0.99 | 4.95 | 9.9 | 15.84 | 68.32 | 5.94 | 84.16 |
| Wyre | 202 | 0 | 3.96 | 1.98 | 12.87 | 18.32 | 62.87 | 5.94 | 81.19 |
| Wakefield | 356 | 0.28 | 3.37 | 2.25 | 9.27 | 17.98 | 66.85 | 5.9 | 84.83 |
| Dartford | 170 | 0 | 1.76 | 4.12 | 9.41 | 25.29 | 59.41 | 5.88 | 84.7 |
| Vale of Glamorgan | 172 | 0 | 2.33 | 3.49 | 24.42 | 25 | 44.77 | 5.82 | 69.77 |
| Haringey | 500 | 0 | 2.6 | 3.2 | 9 | 19.6 | 65.6 | 5.8 | 85.2 |
| Redcar and Cleveland | 191 | 1.05 | 1.57 | 3.14 | 11.52 | 14.14 | 68.59 | 5.76 | 82.73 |
| Tandridge | 139 | 0 | 0 | 5.76 | 11.51 | 28.78 | 53.96 | 5.76 | 82.74 |
| North East Lincolnshire | 210 | 0 | 3.33 | 2.38 | 3.33 | 18.1 | 72.86 | 5.71 | 90.96 |
| Oldham | 298 | 0.67 | 1.34 | 3.69 | 13.76 | 22.15 | 58.39 | 5.7 | 80.54 |
| St Helens | 193 | 0 | 1.55 | 4.15 | 15.03 | 31.09 | 48.19 | 5.7 | 79.28 |
| Runnymede | 211 | 0 | 3.32 | 2.37 | 9 | 10.43 | 74.88 | 5.69 | 85.31 |
| Amber Valley | 159 | 0 | 2.52 | 3.14 | 13.84 | 15.09 | 65.41 | 5.66 | 80.5 |
| Caerphilly | 177 | 0 | 2.26 | 3.39 | 15.82 | 28.81 | 49.72 | 5.65 | 78.53 |
| Central Bedfordshire | 286 | 0 | 2.8 | 2.8 | 24.83 | 26.22 | 43.36 | 5.6 | 69.58 |
| South Hams | 180 | 0.56 | 3.89 | 1.11 | 5 | 20.56 | 68.89 | 5.56 | 89.45 |
| Neath Port Talbot | 254 | 0 | 3.15 | 2.36 | 8.66 | 21.65 | 64.17 | 5.51 | 85.82 |
| East Cambridgeshire | 109 | 0 | 4.59 | 0.92 | 12.84 | 26.61 | 55.05 | 5.51 | 81.66 |
| Mendip | 200 | 0 | 4 | 1.5 | 3.5 | 12.5 | 78.5 | 5.5 | 91 |
|
North West Leicestershire
|
201 | 0 | 3.48 | 1.99 | 6.47 | 19.4 | 68.66 | 5.47 | 88.06 |
| Powys | 349 | 1.72 | 0.86 | 2.87 | 8.88 | 29.23 | 56.45 | 5.45 | 85.68 |
| Solihull | 444 | 0.23 | 3.38 | 1.8 | 10.14 | 14.86 | 69.59 | 5.41 | 84.45 |
| Woking | 167 | 0.6 | 3.59 | 1.2 | 1.8 | 11.38 | 81.44 | 5.39 | 92.82 |
| Oadby and Wigston | 56 | 0 | 1.79 | 3.57 | 7.14 | 17.86 | 69.64 | 5.36 | 87.5 |
| Derby City | 243 | 0.41 | 1.65 | 3.29 | 10.29 | 19.34 | 65.02 | 5.35 | 84.36 |
| South Tyneside | 169 | 0 | 1.78 | 3.55 | 16.57 | 22.49 | 55.62 | 5.33 | 78.11 |
| West Somerset | 113 | 0 | 1.77 | 3.54 | 2.65 | 12.39 | 79.65 | 5.31 | 92.04 |
| Windsor and Maidenhead | 346 | 0.29 | 3.76 | 1.16 | 8.67 | 15.61 | 70.52 | 5.21 | 86.13 |
| South Staffordshire | 96 | 0 | 4.17 | 1.04 | 13.54 | 8.33 | 72.92 | 5.21 | 81.25 |
| West Devon | 96 | 1.04 | 2.08 | 2.08 | 4.17 | 15.63 | 75 | 5.2 | 90.63 |
| Mid Sussex | 231 | 0 | 2.16 | 3.03 | 2.16 | 14.72 | 77.92 | 5.19 | 92.64 |
| Bristol | 890 | 0.56 | 2.92 | 1.69 | 7.53 | 19.89 | 67.42 | 5.17 | 87.31 |
| Lewes | 330 | 0 | 2.73 | 2.42 | 7.88 | 10.61 | 76.36 | 5.15 | 86.97 |
| Rushmoor | 136 | 0 | 2.21 | 2.94 | 11.76 | 23.53 | 59.56 | 5.15 | 83.09 |
| Allerdale | 215 | 0 | 1.4 | 3.72 | 14.42 | 22.79 | 57.67 | 5.12 | 80.46 |
| Hart | 98 | 1.02 | 3.06 | 1.02 | 22.45 | 15.31 | 57.14 | 5.1 | 72.45 |
| Rochford | 59 | 0 | 0 | 5.08 | 6.78 | 10.17 | 77.97 | 5.08 | 88.14 |
| Ipswich | 197 | 0 | 3.55 | 1.52 | 4.57 | 13.2 | 77.16 | 5.07 | 90.36 |
| Charnwood | 257 | 0 | 1.95 | 3.11 | 3.11 | 17.9 | 73.93 | 5.06 | 91.83 |
| Doncaster | 475 | 0.21 | 2.95 | 1.89 | 10.74 | 18.74 | 65.47 | 5.05 | 84.21 |
| Lichfield | 119 | 0.84 | 2.52 | 1.68 | 13.45 | 12.61 | 68.91 | 5.04 | 81.52 |
| Kettering | 120 | 0 | 3.33 | 1.67 | 9.17 | 15 | 70.83 | 5 | 85.83 |
| Blaby | 101 | 0 | 2.97 | 1.98 | 22.77 | 10.89 | 61.39 | 4.95 | 72.28 |
| Greenwich | 406 | 0 | 2.22 | 2.71 | 13.79 | 27.34 | 53.94 | 4.93 | 81.28 |
| Newcastle Upon Tyne | 578 | 0 | 2.25 | 2.6 | 8.82 | 17.82 | 68.51 | 4.85 | 86.33 |
| Cambridge City | 475 | 0 | 3.37 | 1.47 | 6.95 | 15.37 | 72.84 | 4.84 | 88.21 |
| West Lindsey | 124 | 0 | 4.03 | 0.81 | 16.13 | 20.97 | 58.06 | 4.84 | 79.03 |
| Bexley | 270 | 0.74 | 2.59 | 1.48 | 25.56 | 35.56 | 34.07 | 4.81 | 69.63 |
| Gedling | 86 | 1.16 | 0 | 3.49 | 4.65 | 19.77 | 70.93 | 4.65 | 90.7 |
| Leeds | 1215 | 0.08 | 3.05 | 1.48 | 9.05 | 27 | 59.34 | 4.61 | 86.34 |
| South Gloucestershire | 326 | 0 | 1.53 | 3.07 | 6.13 | 9.82 | 79.45 | 4.6 | 89.27 |
| Babergh | 109 | 0 | 2.75 | 1.83 | 2.75 | 12.84 | 79.82 | 4.58 | 92.66 |
| Milton Keynes | 416 | 0 | 0.72 | 3.85 | 7.93 | 23.32 | 64.18 | 4.57 | 87.5 |
| Northampton | 549 | 0.18 | 3.46 | 0.91 | 13.3 | 21.31 | 60.84 | 4.55 | 82.15 |
| Torbay | 264 | 0 | 3.03 | 1.52 | 6.82 | 19.32 | 69.32 | 4.55 | 88.64 |
| Warwick | 310 | 0.32 | 1.94 | 2.26 | 6.13 | 16.13 | 73.23 | 4.52 | 89.36 |
| Cheshire East | 531 | 0.19 | 2.64 | 1.69 | 8.47 | 21.47 | 65.54 | 4.52 | 87.01 |
| Brighton and Hove | 777 | 0 | 3.09 | 1.42 | 10.94 | 21.75 | 62.81 | 4.51 | 84.56 |
| Elmbridge | 247 | 0 | 2.83 | 1.62 | 6.48 | 25.51 | 63.56 | 4.45 | 89.07 |
| Sheffield | 1080 | 0.09 | 2.31 | 2.04 | 10.56 | 23.89 | 61.11 | 4.44 | 85 |
| Nottingham City | 498 | 0.2 | 2.61 | 1.61 | 7.83 | 9.44 | 78.31 | 4.42 | 87.75 |
| Mid Suffolk | 68 | 0 | 1.47 | 2.94 | 5.88 | 13.24 | 76.47 | 4.41 | 89.71 |
| Blackpool | 320 | 0.63 | 3.13 | 0.63 | 8.75 | 25.94 | 60.94 | 4.39 | 86.88 |
| Fenland | 92 | 0 | 0 | 4.35 | 6.52 | 17.39 | 71.74 | 4.35 | 89.13 |
| Chesterfield | 162 | 0.62 | 1.23 | 2.47 | 8.64 | 14.2 | 72.84 | 4.32 | 87.04 |
| Harborough | 139 | 0 | 2.16 | 2.16 | 11.51 | 16.55 | 67.63 | 4.32 | 84.18 |
| Copeland | 93 | 1.08 | 1.08 | 2.15 | 9.68 | 20.43 | 65.59 | 4.31 | 86.02 |
| Tewkesbury | 47 | 0 | 0 | 4.26 | 6.38 | 25.53 | 63.83 | 4.26 | 89.36 |
| Denbighshire | 259 | 0 | 1.54 | 2.7 | 7.34 | 14.67 | 73.75 | 4.24 | 88.42 |
| Wyre Forest | 120 | 0.83 | 1.67 | 1.67 | 15.83 | 14.17 | 65.83 | 4.17 | 80 |
| Knowsley | 96 | 0 | 3.13 | 1.04 | 5.21 | 14.58 | 76.04 | 4.17 | 90.62 |
| West Lancashire | 144 | 0 | 2.08 | 2.08 | 9.72 | 24.31 | 61.81 | 4.16 | 86.12 |
| East Riding of Yorkshire | 487 | 0.21 | 1.44 | 2.46 | 10.88 | 21.36 | 63.66 | 4.11 | 85.02 |
| Middlesbrough | 195 | 0 | 3.08 | 1.03 | 3.08 | 12.82 | 80 | 4.11 | 92.82 |
| Durham | 634 | 0.16 | 1.1 | 2.84 | 11.36 | 21.61 | 62.93 | 4.1 | 84.54 |
| Eden | 172 | 0 | 0.58 | 3.49 | 2.33 | 9.88 | 83.72 | 4.07 | 93.6 |
| Medway | 295 | 0 | 2.71 | 1.36 | 5.08 | 13.9 | 76.95 | 4.07 | 90.85 |
| Poole | 223 | 0 | 0 | 4.04 | 11.21 | 15.7 | 69.06 | 4.04 | 84.76 |
| Reading | 274 | 0.36 | 1.82 | 1.82 | 9.49 | 25.55 | 60.95 | 4 | 86.5 |
| Sutton | 275 | 0 | 1.45 | 2.55 | 14.91 | 25.45 | 55.64 | 4 | 81.09 |
| North Kesteven | 101 | 0 | 0.99 | 2.97 | 2.97 | 14.85 | 78.22 | 3.96 | 93.07 |
| Broxtowe | 152 | 0.66 | 0 | 3.29 | 13.16 | 17.76 | 65.13 | 3.95 | 82.89 |
| Herefordshire | 330 | 0 | 2.12 | 1.82 | 12.73 | 19.39 | 63.94 | 3.94 | 83.33 |
| East Hampshire | 127 | 0 | 0.79 | 3.15 | 6.3 | 29.92 | 59.84 | 3.94 | 89.76 |
| Tunbridge Wells | 204 | 0.49 | 0.98 | 2.45 | 3.92 | 13.24 | 78.92 | 3.92 | 92.16 |
| Ashford | 153 | 0 | 1.31 | 2.61 | 4.58 | 11.76 | 79.74 | 3.92 | 91.5 |
| Stoke-On-Trent | 255 | 0 | 1.96 | 1.96 | 15.29 | 21.57 | 59.22 | 3.92 | 80.79 |
|
Cheshire West and Chester
|
716 | 0 | 2.93 | 0.98 | 8.94 | 20.53 | 66.62 | 3.91 | 87.15 |
| Dover | 206 | 0 | 2.43 | 1.46 | 9.22 | 24.27 | 62.62 | 3.89 | 86.89 |
| Lincoln City | 233 | 0.43 | 0.86 | 2.58 | 5.58 | 15.02 | 75.54 | 3.87 | 90.56 |
| Redditch | 52 | 0 | 0 | 3.85 | 11.54 | 30.77 | 53.85 | 3.85 | 84.62 |
| North Dorset | 78 | 0 | 2.56 | 1.28 | 12.82 | 10.26 | 73.08 | 3.84 | 83.34 |
| Rushcliffe | 131 | 0 | 2.29 | 1.53 | 10.69 | 14.5 | 70.99 | 3.82 | 85.49 |
| Bolsover | 79 | 0 | 2.53 | 1.27 | 0 | 10.13 | 86.08 | 3.8 | 96.21 |
| Tameside | 238 | 0.84 | 0.42 | 2.52 | 10.92 | 13.87 | 71.43 | 3.78 | 85.3 |
| Derbyshire Dales | 216 | 0.46 | 1.85 | 1.39 | 9.26 | 17.13 | 69.91 | 3.7 | 87.04 |
| Cherwell | 163 | 0 | 1.84 | 1.84 | 9.2 | 23.31 | 63.8 | 3.68 | 87.11 |
| Swale | 190 | 0 | 1.05 | 2.63 | 4.74 | 21.05 | 70.53 | 3.68 | 91.58 |
| Wokingham | 164 | 0 | 2.44 | 1.22 | 7.32 | 19.51 | 69.51 | 3.66 | 89.02 |
| Rutland | 55 | 0 | 1.82 | 1.82 | 1.82 | 23.64 | 70.91 | 3.64 | 94.55 |
| Stafford | 222 | 0 | 2.7 | 0.9 | 9.46 | 18.47 | 68.47 | 3.6 | 86.94 |
| St Edmundsbury | 168 | 0 | 0.6 | 2.98 | 2.98 | 14.88 | 78.57 | 3.58 | 93.45 |
| Worthing | 196 | 0.51 | 2.55 | 0.51 | 9.18 | 16.84 | 70.41 | 3.57 | 87.25 |
| Hinckley and Bosworth | 140 | 0 | 0 | 3.57 | 10.71 | 18.57 | 67.14 | 3.57 | 85.71 |
| Test Valley | 170 | 0 | 0.59 | 2.94 | 10 | 22.94 | 63.53 | 3.53 | 86.47 |
| Rother | 202 | 0.5 | 1.98 | 0.99 | 18.81 | 27.72 | 50 | 3.47 | 77.72 |
| Sefton | 432 | 0.46 | 0.69 | 2.31 | 7.41 | 13.89 | 75.23 | 3.46 | 89.12 |
| Southampton | 349 | 0 | 1.72 | 1.72 | 7.74 | 15.47 | 73.35 | 3.44 | 88.82 |
| Gravesham | 116 | 0 | 1.72 | 1.72 | 3.45 | 24.14 | 68.97 | 3.44 | 93.11 |
| Bournemouth | 473 | 0.21 | 1.27 | 1.9 | 9.09 | 21.14 | 66.38 | 3.38 | 87.52 |
| Cotswold | 177 | 0 | 1.69 | 1.69 | 11.3 | 24.29 | 61.02 | 3.38 | 85.31 |
| Bury | 240 | 0 | 2.08 | 1.25 | 5.83 | 15 | 75.83 | 3.33 | 90.83 |
| East Lindsey | 422 | 0 | 2.13 | 1.18 | 9 | 12.56 | 75.12 | 3.31 | 87.68 |
|
Antrim and Newtownabbey
|
182 | 0 | 1.65 | 1.65 | 7.69 | 15.93 | 73.08 | 3.3 | 89.01 |
| Corby | 274 | 0.73 | 1.46 | 1.09 | 10.95 | 18.25 | 67.52 | 3.28 | 85.77 |
| Forest of Dean | 214 | 0 | 0.47 | 2.8 | 11.21 | 21.96 | 63.55 | 3.27 | 85.51 |
| Three Rivers | 93 | 0 | 1.08 | 2.15 | 17.2 | 32.26 | 47.31 | 3.23 | 79.57 |
| Thurrock | 187 | 0.53 | 1.6 | 1.07 | 14.44 | 12.3 | 70.05 | 3.2 | 82.35 |
| Havant | 127 | 0 | 3.15 | 0 | 6.3 | 11.81 | 78.74 | 3.15 | 90.55 |
| Norwich City | 353 | 0.28 | 1.42 | 1.42 | 16.15 | 21.53 | 59.21 | 3.12 | 80.74 |
| Harlow | 96 | 0 | 1.04 | 2.08 | 8.33 | 18.75 | 69.79 | 3.12 | 88.54 |
| Surrey Heath | 129 | 0 | 1.55 | 1.55 | 5.43 | 17.05 | 74.42 | 3.1 | 91.47 |
| Swansea | 421 | 0.24 | 2.61 | 0.24 | 8.79 | 21.62 | 66.51 | 3.09 | 88.13 |
| Hartlepool | 131 | 0 | 0.76 | 2.29 | 6.11 | 13.74 | 77.1 | 3.05 | 90.84 |
| East Staffordshire | 232 | 0 | 0.86 | 2.16 | 4.31 | 31.47 | 61.21 | 3.02 | 92.68 |
| North Norfolk | 300 | 0 | 0.67 | 2.33 | 6.33 | 12 | 78.67 | 3 | 90.67 |
| Horsham | 444 | 0.23 | 0.9 | 1.8 | 4.5 | 24.1 | 68.47 | 2.93 | 92.57 |
| Cornwall | 1421 | 0.14 | 0.99 | 1.76 | 8.52 | 18.16 | 70.44 | 2.89 | 88.6 |
| Craven | 141 | 0.71 | 1.42 | 0.71 | 4.96 | 16.31 | 75.89 | 2.84 | 92.2 |
| Tendring | 176 | 0 | 0.57 | 2.27 | 4.55 | 21.59 | 71.02 | 2.84 | 92.61 |
| Stratford-on-Avon | 212 | 0 | 1.42 | 1.42 | 11.32 | 25.47 | 60.38 | 2.84 | 85.85 |
| Chiltern | 71 | 0 | 1.41 | 1.41 | 22.54 | 30.99 | 43.66 | 2.82 | 74.65 |
| Forest Heath | 107 | 0 | 1.87 | 0.93 | 3.74 | 14.95 | 78.5 | 2.8 | 93.45 |
| Tonbridge and Malling | 143 | 0 | 0 | 2.8 | 13.99 | 23.78 | 59.44 | 2.8 | 83.22 |
| Sedgemoor | 182 | 0 | 0.55 | 2.2 | 4.4 | 15.93 | 76.92 | 2.75 | 92.85 |
| Daventry | 110 | 0 | 2.73 | 0 | 1.82 | 15.45 | 80 | 2.73 | 95.45 |
| North East Derbyshire | 74 | 1.35 | 0 | 1.35 | 8.11 | 8.11 | 81.08 | 2.7 | 89.19 |
| Gateshead | 222 | 0 | 1.35 | 1.35 | 9.01 | 18.02 | 70.27 | 2.7 | 88.29 |
| Colchester | 261 | 0 | 2.68 | 0 | 8.05 | 16.86 | 72.41 | 2.68 | 89.27 |
| South Kesteven | 187 | 0 | 1.07 | 1.6 | 4.28 | 14.44 | 78.61 | 2.67 | 93.05 |
| South Somerset | 226 | 0 | 1.33 | 1.33 | 6.19 | 15.93 | 75.22 | 2.66 | 91.15 |
| Flintshire | 189 | 0 | 2.12 | 0.53 | 5.82 | 18.52 | 73.02 | 2.65 | 91.54 |
| Eastleigh | 152 | 0.66 | 0.66 | 1.32 | 3.95 | 25 | 68.42 | 2.64 | 93.42 |
| Carmarthenshire | 341 | 0 | 1.47 | 1.17 | 7.33 | 16.72 | 73.31 | 2.64 | 90.03 |
| Thanet | 347 | 0 | 1.44 | 1.15 | 0.29 | 10.09 | 87.03 | 2.59 | 97.12 |
| Exeter City | 275 | 0.36 | 1.45 | 0.73 | 5.45 | 20 | 72 | 2.54 | 92 |
| Basildon | 197 | 0 | 1.02 | 1.52 | 8.12 | 10.66 | 78.68 | 2.54 | 89.34 |
| Chichester | 241 | 0 | 0.41 | 2.07 | 3.73 | 17.01 | 76.76 | 2.48 | 93.77 |
|
Bath and North East Somerset
|
371 | 0 | 0.81 | 1.62 | 7.82 | 20.49 | 69.27 | 2.43 | 89.76 |
| Staffordshire Moorlands | 125 | 0 | 1.6 | 0.8 | 9.6 | 25.6 | 62.4 | 2.4 | 88 |
| Stockton On Tees | 208 | 0 | 0.96 | 1.44 | 6.25 | 12.02 | 79.33 | 2.4 | 91.35 |
| Scarborough | 380 | 0 | 1.05 | 1.32 | 4.74 | 13.16 | 79.74 | 2.37 | 92.9 |
| South Holland | 87 | 0 | 0 | 2.3 | 8.05 | 28.74 | 60.92 | 2.3 | 89.66 |
| Maidstone | 220 | 0 | 0.91 | 1.36 | 2.73 | 17.73 | 77.27 | 2.27 | 95 |
|
King's Lynn and West Norfolk
|
221 | 0 | 1.36 | 0.9 | 9.95 | 21.72 | 66.06 | 2.26 | 87.78 |
| Cannock Chase | 133 | 0 | 2.26 | 0 | 5.26 | 6.77 | 85.71 | 2.26 | 92.48 |
| Ards and North Down | 265 | 0 | 1.51 | 0.75 | 6.79 | 22.64 | 68.3 | 2.26 | 90.94 |
| Cheltenham | 225 | 0 | 1.78 | 0.44 | 17.33 | 32.44 | 48 | 2.22 | 80.44 |
| Burnley | 135 | 0 | 0.74 | 1.48 | 5.93 | 18.52 | 73.33 | 2.22 | 91.85 |
| Boston | 91 | 0 | 2.2 | 0 | 8.79 | 10.99 | 78.02 | 2.2 | 89.01 |
| Selby | 46 | 0 | 2.17 | 0 | 6.52 | 23.91 | 67.39 | 2.17 | 91.3 |
| South Ribble | 93 | 0 | 2.15 | 0 | 17.2 | 11.83 | 68.82 | 2.15 | 80.65 |
| Wolverhampton | 234 | 0 | 1.71 | 0.43 | 1.71 | 6.41 | 89.74 | 2.14 | 96.15 |
| Teignbridge | 234 | 0 | 0.85 | 1.28 | 1.71 | 6.84 | 89.32 | 2.13 | 96.16 |
| Wrexham | 282 | 0 | 1.77 | 0.35 | 7.09 | 8.51 | 82.27 | 2.12 | 90.78 |
| Conwy | 286 | 0 | 1.4 | 0.7 | 6.29 | 19.23 | 72.38 | 2.1 | 91.61 |
| Canterbury City | 335 | 0 | 0.3 | 1.79 | 16.42 | 17.61 | 63.88 | 2.09 | 81.49 |
| South Northamptonshire | 97 | 0 | 2.06 | 0 | 10.31 | 29.9 | 57.73 | 2.06 | 87.63 |
|
Causeway Coast and Glens
|
292 | 0 | 1.37 | 0.68 | 6.85 | 17.47 | 73.63 | 2.05 | 91.1 |
| Ribble Valley | 99 | 0 | 1.01 | 1.01 | 6.06 | 8.08 | 83.84 | 2.02 | 91.92 |
| Gloucester City | 403 | 0.5 | 0.5 | 0.99 | 0.99 | 10.67 | 86.35 | 1.99 | 97.02 |
| Torridge | 101 | 0 | 1.98 | 0 | 2.97 | 10.89 | 84.16 | 1.98 | 95.05 |
| Plymouth City | 407 | 0 | 1.97 | 0 | 9.34 | 16.22 | 72.48 | 1.97 | 88.7 |
| Rossendale | 102 | 0 | 0 | 1.96 | 4.9 | 4.9 | 88.24 | 1.96 | 93.14 |
| Epping Forest | 204 | 0 | 0.98 | 0.98 | 12.75 | 17.16 | 68.14 | 1.96 | 85.3 |
| Shropshire | 724 | 0 | 0.97 | 0.97 | 7.73 | 17.54 | 72.79 | 1.94 | 90.33 |
| Hastings | 263 | 0 | 1.14 | 0.76 | 5.32 | 10.65 | 82.13 | 1.9 | 92.78 |
| Ashfield | 106 | 0 | 0.94 | 0.94 | 3.77 | 3.77 | 90.57 | 1.88 | 94.34 |
| Brentwood | 107 | 0 | 1.87 | 0 | 7.48 | 14.95 | 75.7 | 1.87 | 90.65 |
| High Peak | 163 | 1.23 | 0.61 | 0 | 7.98 | 11.66 | 78.53 | 1.84 | 90.19 |
| Stroud | 165 | 0 | 1.82 | 0 | 7.27 | 13.33 | 77.58 | 1.82 | 90.91 |
| Purbeck | 114 | 0 | 0.88 | 0.88 | 6.14 | 22.81 | 69.3 | 1.76 | 92.11 |
| Guildford | 57 | 0 | 0 | 1.75 | 10.53 | 19.3 | 68.42 | 1.75 | 87.72 |
| Halton | 115 | 0 | 0.87 | 0.87 | 6.96 | 17.39 | 73.91 | 1.74 | 91.3 |
| West Oxfordshire | 251 | 0 | 0.4 | 1.2 | 3.19 | 11.55 | 83.67 | 1.6 | 95.22 |
| Nuneaton and Bedworth | 125 | 0 | 1.6 | 0 | 5.6 | 21.6 | 71.2 | 1.6 | 92.8 |
| Carlisle City | 191 | 0 | 0.52 | 1.05 | 5.76 | 11.52 | 81.15 | 1.57 | 92.67 |
| Mid Ulster | 197 | 0 | 0.51 | 1.02 | 4.57 | 24.37 | 69.54 | 1.53 | 93.91 |
| Chelmsford | 197 | 0 | 1.52 | 0 | 5.08 | 10.15 | 83.25 | 1.52 | 93.4 |
| Winchester City | 202 | 0 | 0.99 | 0.5 | 6.44 | 11.88 | 80.2 | 1.49 | 92.08 |
| Belfast City | 835 | 0 | 0.48 | 0.96 | 11.62 | 21.68 | 65.27 | 1.44 | 86.95 |
| Richmondshire | 141 | 0 | 1.42 | 0 | 4.96 | 16.31 | 77.3 | 1.42 | 93.61 |
| South Lakeland | 425 | 0 | 0.47 | 0.94 | 8.24 | 18.59 | 71.76 | 1.41 | 90.35 |
| Newark and Sherwood | 214 | 0 | 0 | 1.4 | 5.14 | 7.01 | 86.45 | 1.4 | 93.46 |
| Derry City and Strabane | 216 | 0 | 0 | 1.39 | 10.65 | 23.61 | 64.35 | 1.39 | 87.96 |
| Mid Devon | 73 | 0 | 0 | 1.37 | 5.48 | 9.59 | 83.56 | 1.37 | 93.15 |
|
Newry, Mourne and Down
|
297 | 0 | 0 | 1.35 | 5.05 | 20.2 | 73.4 | 1.35 | 93.6 |
| Suffolk Coastal | 225 | 0 | 0 | 1.33 | 1.78 | 14.22 | 82.67 | 1.33 | 96.89 |
| Stevenage | 75 | 0 | 1.33 | 0 | 1.33 | 17.33 | 80 | 1.33 | 97.33 |
| East Northamptonshire | 76 | 0 | 0 | 1.32 | 6.58 | 18.42 | 73.68 | 1.32 | 92.1 |
| Harrogate | 315 | 0 | 0.32 | 0.95 | 4.76 | 11.75 | 82.22 | 1.27 | 93.97 |
| Bassetlaw | 166 | 0 | 0.6 | 0.6 | 6.02 | 7.83 | 84.94 | 1.2 | 92.77 |
| Bromsgrove | 83 | 0 | 1.2 | 0 | 15.66 | 24.1 | 59.04 | 1.2 | 83.14 |
| Crawley | 90 | 0 | 0 | 1.11 | 3.33 | 11.11 | 84.44 | 1.11 | 95.55 |
| Maldon | 93 | 0 | 0 | 1.08 | 4.3 | 13.98 | 80.65 | 1.08 | 94.63 |
| Warrington | 277 | 0 | 0.72 | 0.36 | 5.05 | 16.97 | 76.9 | 1.08 | 93.87 |
| Mid and East Antrim | 185 | 0 | 0.54 | 0.54 | 9.73 | 20.54 | 68.65 | 1.08 | 89.19 |
| Gwynedd | 477 | 0.21 | 0.84 | 0 | 5.24 | 17.82 | 75.89 | 1.05 | 93.71 |
| Basingstoke and Deane | 190 | 0 | 1.05 | 0 | 6.32 | 22.63 | 70 | 1.05 | 92.63 |
| Weymouth and Portland | 195 | 0 | 0 | 1.03 | 3.59 | 17.95 | 77.44 | 1.03 | 95.39 |
| Broxbourne | 108 | 0 | 0 | 0.93 | 6.48 | 14.81 | 77.78 | 0.93 | 92.59 |
| Northumberland | 561 | 0 | 0.71 | 0.18 | 6.24 | 13.55 | 79.32 | 0.89 | 92.87 |
| Broadland | 114 | 0 | 0.88 | 0 | 3.51 | 12.28 | 83.33 | 0.88 | 95.61 |
| Eastbourne | 229 | 0 | 0.87 | 0 | 10.48 | 13.1 | 75.55 | 0.87 | 88.65 |
| North Devon | 344 | 0 | 0.29 | 0.58 | 2.33 | 9.88 | 86.92 | 0.87 | 96.8 |
| East Dorset | 117 | 0 | 0.85 | 0 | 6.84 | 12.82 | 79.49 | 0.85 | 92.31 |
| Anglesey | 125 | 0 | 0 | 0.8 | 5.6 | 22.4 | 71.2 | 0.8 | 93.6 |
| South Norfolk | 129 | 0 | 0.78 | 0 | 1.55 | 5.43 | 92.25 | 0.78 | 97.68 |
| West Dorset | 260 | 0 | 0.38 | 0.38 | 3.08 | 19.23 | 76.92 | 0.76 | 96.15 |
| Worcester City | 139 | 0 | 0.72 | 0 | 6.47 | 20.86 | 71.94 | 0.72 | 92.8 |
| Hambleton | 151 | 0 | 0 | 0.66 | 7.28 | 16.56 | 75.5 | 0.66 | 92.06 |
| Darlington | 161 | 0 | 0 | 0.62 | 0.62 | 4.35 | 94.41 | 0.62 | 98.76 |
| Sunderland | 329 | 0 | 0 | 0.61 | 16.72 | 22.8 | 59.88 | 0.61 | 82.68 |
| Braintree | 175 | 0.57 | 0 | 0 | 2.29 | 19.43 | 77.71 | 0.57 | 97.14 |
| Pendle | 202 | 0 | 0.5 | 0 | 4.95 | 13.86 | 80.69 | 0.5 | 94.55 |
| South Cambridgeshire | 212 | 0 | 0.47 | 0 | 1.89 | 15.57 | 82.08 | 0.47 | 97.65 |
| Wealden | 226 | 0 | 0.44 | 0 | 11.06 | 31.86 | 56.64 | 0.44 | 88.5 |
| South Derbyshire | 106 | 0 | 0 | 0 | 0.94 | 9.43 | 89.62 | 0 | 99.05 |
| Christchurch | 80 | 0 | 0 | 0 | 3.75 | 17.5 | 78.75 | 0 | 96.25 |
|
Lisburn and Castlereagh City
|
178 | 0 | 0 | 0 | 5.62 | 17.98 | 76.4 | 0 | 94.38 |
|
Armagh City, Banbridge and Craigavon
|
268 | 0 | 0 | 0 | 8.21 | 23.88 | 67.91 | 0 | 91.79 |
| Melton | 81 | 0 | 0 | 0 | 11.11 | 20.99 | 67.9 | 0 | 88.89 |
| Newcastle-Under-Lyme | 89 | 0 | 0 | 0 | 7.87 | 26.97 | 65.17 | 0 | 92.14 |
| Fermanagh and Omagh | 201 | 0 | 0 | 0 | 9.45 | 26.37 | 64.18 | 0 | 90.55 |
| Wychavon | 142 | 0 | 0 | 0 | 14.79 | 21.13 | 64.08 | 0 | 85.21 |
| Erewash | 128 | 0 | 0 | 0 | 10.16 | 31.25 | 58.59 | 0 | 89.84 |
| Malvern Hills | 83 | 0 | 0 | 0 | 6.02 | 36.14 | 57.83 | 0 | 93.97 |
Please note, 3 areas are not included in the table as they have less than 30 applicable establishments in their council districts. These are Isles of Scilly, River Tees and Gosport