
Following on from our restaurant and takeaway studies, Lovemyvouchers.co.uk have carried out an in depth study into food hygiene ratings for pubs, bars and nightclubs in the United Kingdom.
In order to find out which areas of the country are doing the best when it comes to meeting the Food Standards Agency health and safety standards, we looked at the ratings that businesses have been awarded through local authority inspections under the Food Hygiene Rating Scheme.
There were some interesting results; so if you want to discover how your home town has fared, check out the table below.
Please note, Scotland is excluded from the results as they have a different rating system.
Key Findings
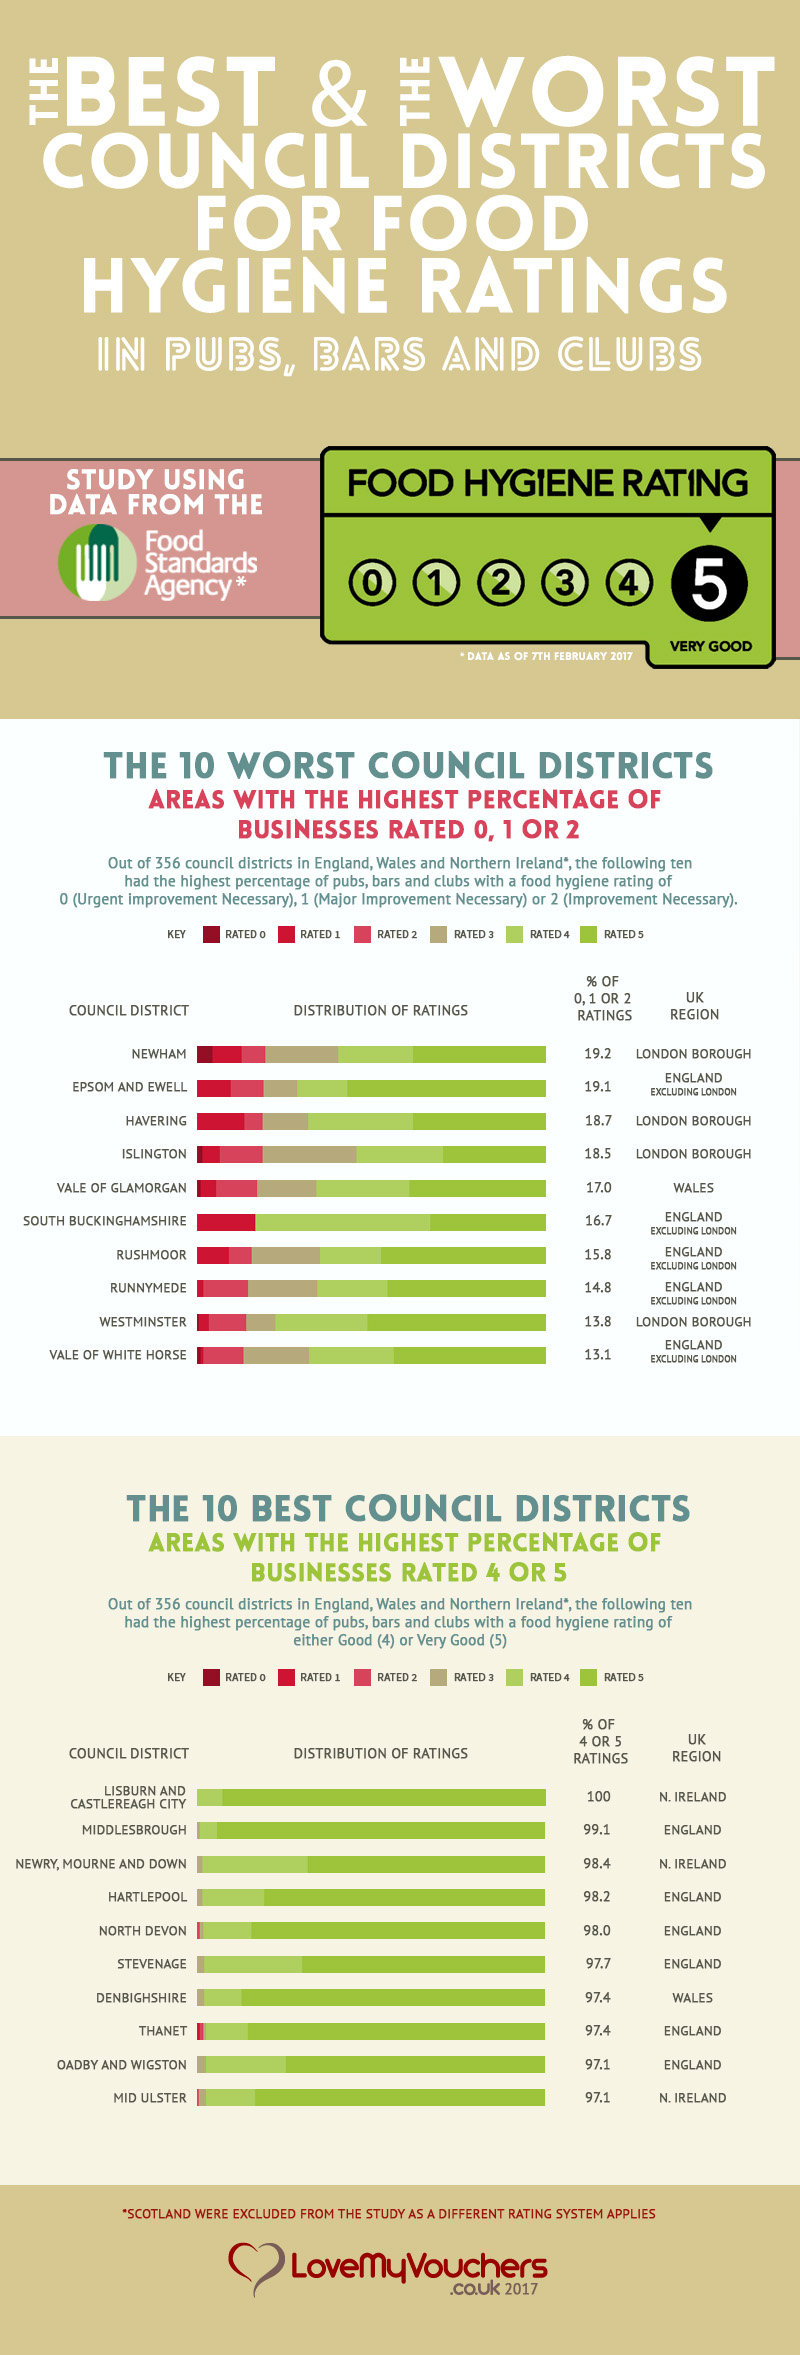
- The council district that performed the best overall was Lisburn and Castlereagh City, with 100% of its 14 pubs, bars and nightclubs rated good (4) or very good (5). Middlesbrough were not far behind, with 98.1% of its 106 applicable businesses rated 4 and 5, and no 0, 1 or 2 ratings.
- As with the restaurant and the takeaways study, the London Boroughs were found to be the worst performing areas overall, with Newham, Havering, Islington and Westminster, all appearing in top ten worst areas, ranked by the highest proportion of 0, 1 and 2 ratings.
- Newham was the worst performing district, with the highest percentage of zero ratings, as well as the highest proportion of 0, 1 and 2 ratings.
- Outside of London, the worst performing areas were found to be Epsom and Ewell, Vale of Glamorgan, and South Buckinghamshire.
Council Districts with the Best Food Hygiene Ratings in Pubs, Bars and Nightclubs
The area with the best ratings was Lisburn and Castlereagh City in Northern Ireland, where out of 14 applicable businesses, 100% were rated good (4) or very good (5).
With over seven times as many applicable businesses, Middlesborough was less than 1% behind, with 99.1% rated 4 or 5.
Newry, Mourne and Down, also in Northern Ireland, ranked third, with 98.4% of its 126 businesses rated good or very good.
Other areas with a high percentage of pubs and bars scoring 4 or above include Hartlepool (98.2%), North Devon (98%), Stevenage (97.7%) and Denbighshire (97.4%).
Middlesbrough had the highest percentage of pubs, bars and nightclubs with the top rating of 5, at 94.3%.
Other areas with a high percentage of pubs awarded 5/5 for food hygiene include Lisburn and Castlereagh City (92.9%), Darlington (92.8%), Denbighshire (87.2%) and Maidstone (86.6%).
285 out of the 356 council districts included in the study have no pubs, bars and clubs with a zero rating, with examples including Oadby and Wigston, Mid Ulster and Wolverhampton. 26 districts did not have any 0, 1 or 2 ratings, including Gloucester City, Derry City and Strabane, Boston, and Antrim and Newtownabbey.
The best London borough was Redbridge, with no 0 or 1 ratings, and just 3.5% of pubs and bars awarded a rating of 2. 93% of applicable businesses received a 4 or 5 rating.
Council Districts with the Worst Food Hygiene Ratings in Pubs, Bars and Nightclubs
Newham had the highest percentage of pubs, bars and clubs rated between 0 and 2, with 19.2% of its applicable businesses requiring improvement. Epsom and Ewell had 19.1%, and Havering had 18.7% with 0, 1 and 2 ratings.
Newham also had the highest percentage of pubs and bars with a zero hygiene rating. Of the 47 eateries in the area, 4.3% were given the lowest possible rating at their latest inspection.
Other areas with a high percentage of zero rated pubs and bars include Tewkesbury (2.3%), Ipswich (1.7%), City of London Corporation (1.6%) and Tamworth (1.6%).
Wigan had the lowest percentage of eateries rated 5, with just 15.5% out of 194 premises in total, and the lowest percentage rated 4 or 5, at just 42.3%.
Other areas which have a low percentage of businesses awarded 5 include Torfaen (23.5%), Hackney (25%), Dudley (26.2%) and St Helens (26.4%).
Other areas with a low percentage of 4 and 5 rated businesses include Hackney (50.5%), Islington (54.5%), Sandwell (57.6%) and Harrow (59.5%).
Pubs, Bars and Nightclubs in England, Wales and Northern Ireland
The following data is from the Food Standards Agency website, food.gov.uk, and is correct as at February 7th 2017.
Please note, 5 areas are not included in the table as they have no applicable establishments in their council districts. These are River Tees, Corby, Rochford, Tower Hamlets.
Pubs, Bars and Nightclubs that were excempt from the Rating Scheme were not included in the figures.
| Council Area | Total Number of Businesses | % Rated 0 | % Rated 1 | % Rated 2 | % Rated 3 | % Rated 4 | % Rated 5 | % Rated 0,1 & 2 | % Rated 4 & 5 |
|---|---|---|---|---|---|---|---|---|---|
| Lisburn and Castlereagh City | 14 | 0 | 0 | 0 | 0 | 7.14 | 92.86 | 0 | 100 |
| Middlesbrough | 106 | 0 | 0 | 0 | 0.94 | 4.72 | 94.34 | 0 | 99.06 |
| Newry, Mourne and Down | 126 | 0 | 0 | 0 | 1.59 | 30.16 | 68.25 | 0 | 98.41 |
| Hartlepool | 109 | 0 | 0 | 0 | 1.83 | 17.43 | 80.73 | 0 | 98.17 |
| North Devon | 147 | 0 | 0.68 | 0 | 1.36 | 13.61 | 84.35 | 0.68 | 97.96 |
| Stevenage | 43 | 0 | 0 | 0 | 2.33 | 27.91 | 69.77 | 0 | 97.67 |
| Denbighshire | 39 | 0 | 0 | 0 | 2.56 | 10.26 | 87.18 | 0 | 97.44 |
| Thanet | 151 | 0 | 0.66 | 1.32 | 0.66 | 11.92 | 85.43 | 1.99 | 97.35 |
| Oadby and Wigston | 35 | 0 | 0 | 0 | 2.86 | 22.86 | 74.29 | 0 | 97.14 |
| Mid Ulster | 138 | 0 | 0 | 0.72 | 2.17 | 13.77 | 83.33 | 0.72 | 97.1 |
| Wolverhampton | 125 | 0 | 0.8 | 0 | 2.4 | 13.6 | 83.2 | 0.8 | 96.8 |
| Darlington | 111 | 0.9 | 0 | 0.9 | 1.8 | 3.6 | 92.79 | 1.8 | 96.4 |
| Forest Heath | 54 | 0 | 0 | 0 | 3.7 | 22.22 | 74.07 | 0 | 96.3 |
| Boston | 74 | 0 | 1.35 | 0 | 2.7 | 18.92 | 77.03 | 1.35 | 95.95 |
| Gloucester City | 24 | 0 | 0 | 0 | 4.17 | 12.5 | 83.33 | 0 | 95.83 |
| Nottingham City | 257 | 0 | 0.78 | 0.78 | 2.72 | 16.34 | 79.38 | 1.56 | 95.72 |
| Derry City and Strabane | 115 | 0 | 0 | 0 | 4.35 | 33.04 | 62.61 | 0 | 95.65 |
| Tunbridge Wells | 88 | 0 | 1.14 | 1.14 | 2.27 | 9.09 | 86.36 | 2.27 | 95.45 |
| Bedford | 129 | 0 | 0 | 0.78 | 3.88 | 32.56 | 62.79 | 0.78 | 95.35 |
| Causeway Coast and Glens | 107 | 0 | 0.93 | 1.87 | 1.87 | 20.56 | 74.77 | 2.8 | 95.33 |
|
Armagh City, Banbridge and Craigavon
|
105 | 0 | 0 | 2.86 | 1.9 | 25.71 | 69.52 | 2.86 | 95.24 |
| Fermanagh and Omagh | 125 | 0 | 0 | 0.8 | 4 | 35.2 | 60 | 0.8 | 95.2 |
| Harborough | 83 | 0 | 1.2 | 0 | 3.61 | 32.53 | 62.65 | 1.2 | 95.18 |
| Harlow | 62 | 0 | 1.61 | 0 | 3.23 | 24.19 | 70.97 | 1.61 | 95.16 |
| Antrim and Newtownabbey | 59 | 0 | 0 | 0 | 5.08 | 37.29 | 57.63 | 0 | 94.92 |
| Hastings | 77 | 0 | 0 | 2.6 | 2.6 | 11.69 | 83.12 | 2.6 | 94.81 |
| Maidstone | 112 | 0 | 0.89 | 0.89 | 3.57 | 8.04 | 86.61 | 1.79 | 94.64 |
| Teignbridge | 149 | 0 | 0.67 | 0 | 4.7 | 14.09 | 80.54 | 0.67 | 94.63 |
| Rossendale | 74 | 0 | 0 | 0 | 5.41 | 25.68 | 68.92 | 0 | 94.59 |
| Barrow-in-Furness | 104 | 0 | 0.96 | 0 | 4.81 | 12.5 | 81.73 | 0.96 | 94.23 |
| Pendle | 102 | 0 | 0 | 0 | 5.88 | 16.67 | 77.45 | 0 | 94.12 |
| Suffolk Coastal | 135 | 0 | 0 | 1.48 | 4.44 | 17.78 | 76.3 | 1.48 | 94.07 |
| Rutland | 50 | 0 | 2 | 0 | 4 | 28 | 66 | 2 | 94 |
| Maldon | 66 | 0 | 1.52 | 0 | 4.55 | 16.67 | 77.27 | 1.52 | 93.94 |
| South Kesteven | 131 | 0 | 0 | 0.76 | 5.34 | 15.27 | 78.63 | 0.76 | 93.89 |
| Barnsley | 258 | 0 | 1.16 | 0.78 | 4.26 | 27.91 | 65.89 | 1.94 | 93.8 |
| North East Lincolnshire | 145 | 0 | 0 | 1.38 | 4.83 | 16.55 | 77.24 | 1.38 | 93.79 |
| Eastbourne | 64 | 0 | 0 | 1.56 | 4.69 | 20.31 | 73.44 | 1.56 | 93.75 |
| Watford | 31 | 0 | 3.23 | 3.23 | 0 | 22.58 | 70.97 | 6.45 | 93.55 |
| Lincoln City | 93 | 1.08 | 0 | 1.08 | 4.3 | 26.88 | 66.67 | 2.15 | 93.55 |
| Broxbourne | 46 | 0 | 0 | 2.17 | 4.35 | 26.09 | 67.39 | 2.17 | 93.48 |
| Ribble Valley | 106 | 0 | 0 | 1.89 | 4.72 | 16.04 | 77.36 | 1.89 | 93.4 |
| South Norfolk | 90 | 0 | 1.11 | 1.11 | 4.44 | 12.22 | 81.11 | 2.22 | 93.33 |
| Eden | 118 | 0.85 | 0 | 1.69 | 4.24 | 10.17 | 83.05 | 2.54 | 93.22 |
| Bolsover | 88 | 0 | 0 | 1.14 | 5.68 | 19.32 | 73.86 | 1.14 | 93.18 |
| Elmbridge | 130 | 0 | 0 | 0.77 | 6.15 | 15.38 | 77.69 | 0.77 | 93.08 |
| Redbridge | 86 | 0 | 0 | 3.49 | 3.49 | 12.79 | 80.23 | 3.49 | 93.02 |
| Brentwood | 96 | 0 | 0 | 0 | 7.29 | 17.71 | 75 | 0 | 92.71 |
| Haringey | 95 | 0 | 1.05 | 3.16 | 3.16 | 23.16 | 69.47 | 4.21 | 92.63 |
| Belfast City | 188 | 0 | 0 | 0.53 | 6.91 | 42.02 | 50.53 | 0.53 | 92.55 |
| Salford | 188 | 0 | 0.53 | 2.13 | 4.79 | 17.55 | 75 | 2.66 | 92.55 |
| Basildon | 67 | 0 | 2.99 | 0 | 4.48 | 14.93 | 77.61 | 2.99 | 92.54 |
| Bassetlaw | 120 | 0.83 | 1.67 | 0 | 5 | 16.67 | 75.83 | 2.5 | 92.5 |
| Gwynedd | 158 | 0 | 0.63 | 1.9 | 5.06 | 19.62 | 72.78 | 2.53 | 92.41 |
| Eastleigh | 65 | 0 | 0 | 3.08 | 4.62 | 21.54 | 70.77 | 3.08 | 92.31 |
| South Derbyshire | 104 | 0 | 0 | 0.96 | 6.73 | 15.38 | 76.92 | 0.96 | 92.31 |
| Cannock Chase | 103 | 0 | 0 | 0 | 7.77 | 14.56 | 77.67 | 0 | 92.23 |
| Daventry | 90 | 0 | 1.11 | 0 | 6.67 | 22.22 | 70 | 1.11 | 92.22 |
| Torridge | 90 | 0 | 0 | 2.22 | 5.56 | 13.33 | 78.89 | 2.22 | 92.22 |
| East Dorset | 51 | 0 | 0 | 0 | 7.84 | 23.53 | 68.63 | 0 | 92.16 |
| Mid Devon | 89 | 0 | 0 | 2.25 | 5.62 | 14.61 | 77.53 | 2.25 | 92.13 |
| Reigate and Banstead | 63 | 0 | 1.59 | 3.17 | 3.17 | 22.22 | 69.84 | 4.76 | 92.06 |
| Chorley | 113 | 0 | 1.77 | 0.88 | 5.31 | 23.01 | 69.03 | 2.65 | 92.04 |
| Harrogate | 211 | 0 | 0 | 0 | 8.06 | 18.96 | 72.99 | 0 | 91.94 |
| Newcastle Upon Tyne | 272 | 0 | 0.74 | 1.47 | 5.88 | 28.68 | 63.24 | 2.21 | 91.91 |
| Derby City | 208 | 0 | 1.44 | 1.44 | 5.29 | 24.52 | 67.31 | 2.88 | 91.83 |
| Scarborough | 208 | 0 | 0 | 0.48 | 7.69 | 22.12 | 69.71 | 0.48 | 91.83 |
| Bristol | 427 | 0.23 | 1.41 | 0.94 | 5.62 | 21.31 | 70.49 | 2.58 | 91.8 |
| Swale | 121 | 0 | 2.48 | 0 | 5.79 | 26.45 | 65.29 | 2.48 | 91.74 |
| Havant | 72 | 0 | 0 | 1.39 | 6.94 | 8.33 | 83.33 | 1.39 | 91.67 |
| Medway | 131 | 0 | 3.05 | 1.53 | 3.82 | 25.95 | 65.65 | 4.58 | 91.6 |
| Basingstoke and Deane | 107 | 0 | 2.8 | 0.93 | 4.67 | 21.5 | 70.09 | 3.74 | 91.59 |
| Warrington | 198 | 0 | 2.02 | 1.52 | 5.05 | 23.74 | 67.68 | 3.54 | 91.41 |
| Ards and North Down | 23 | 0 | 0 | 0 | 8.7 | 26.09 | 65.22 | 0 | 91.3 |
| West Dorset | 138 | 0 | 0 | 0.72 | 7.97 | 23.19 | 68.12 | 0.72 | 91.3 |
| St Edmundsbury | 78 | 0 | 2.56 | 2.56 | 3.85 | 15.38 | 75.64 | 5.13 | 91.03 |
| Sefton | 254 | 0 | 0.79 | 1.97 | 6.3 | 16.54 | 74.41 | 2.76 | 90.94 |
| Surrey Heath | 33 | 0 | 0 | 9.09 | 0 | 9.09 | 81.82 | 9.09 | 90.91 |
| Chesterfield | 132 | 0 | 0.76 | 2.27 | 6.06 | 28.03 | 62.88 | 3.03 | 90.91 |
| Conwy | 165 | 0 | 3.03 | 1.82 | 4.24 | 20 | 70.91 | 4.85 | 90.91 |
| Durham | 659 | 0 | 0.76 | 0.91 | 7.59 | 33.69 | 57.06 | 1.67 | 90.74 |
| Chichester | 151 | 0 | 1.99 | 3.31 | 3.97 | 23.18 | 67.55 | 5.3 | 90.73 |
| Pembrokeshire | 235 | 0 | 2.13 | 2.13 | 5.11 | 30.21 | 60.43 | 4.26 | 90.64 |
| Mid and East Antrim | 106 | 0 | 0.94 | 0 | 8.49 | 28.3 | 62.26 | 0.94 | 90.57 |
| Sedgemoor | 168 | 0 | 2.38 | 2.98 | 4.17 | 25 | 65.48 | 5.36 | 90.48 |
| Milton Keynes | 135 | 0 | 0.74 | 1.48 | 7.41 | 28.89 | 61.48 | 2.22 | 90.37 |
| Thurrock | 62 | 0 | 0 | 1.61 | 8.06 | 16.13 | 74.19 | 1.61 | 90.32 |
| Northumberland | 454 | 0 | 0.66 | 0.66 | 8.59 | 24.45 | 65.64 | 1.32 | 90.09 |
| South Cambridgeshire | 70 | 0 | 2.86 | 0 | 7.14 | 24.29 | 65.71 | 2.86 | 90 |
| Flintshire | 149 | 0 | 0 | 5.37 | 4.7 | 26.85 | 63.09 | 5.37 | 89.93 |
| Erewash | 118 | 0 | 0 | 2.54 | 7.63 | 35.59 | 54.24 | 2.54 | 89.83 |
| Bournemouth | 108 | 0.93 | 0.93 | 1.85 | 6.48 | 17.59 | 72.22 | 3.7 | 89.81 |
| Leeds | 628 | 0 | 1.91 | 1.43 | 6.85 | 35.03 | 54.78 | 3.34 | 89.81 |
| Waveney | 107 | 0.93 | 1.87 | 1.87 | 5.61 | 25.23 | 64.49 | 4.67 | 89.72 |
| Craven | 97 | 0 | 3.09 | 2.06 | 5.15 | 19.59 | 70.1 | 5.15 | 89.69 |
| Richmondshire | 48 | 0 | 0 | 6.25 | 4.17 | 8.33 | 81.25 | 6.25 | 89.58 |
| Colchester | 105 | 0 | 0.95 | 0.95 | 8.57 | 27.62 | 61.9 | 1.9 | 89.52 |
| Bury | 57 | 0 | 1.75 | 3.51 | 5.26 | 15.79 | 73.68 | 5.26 | 89.47 |
| Tendring | 93 | 1.08 | 2.15 | 1.08 | 6.45 | 17.2 | 72.04 | 4.3 | 89.25 |
| Wrexham | 93 | 0 | 0 | 0 | 10.75 | 15.05 | 74.19 | 0 | 89.25 |
| East Northamptonshire | 111 | 0.9 | 0 | 1.8 | 8.11 | 36.94 | 52.25 | 2.7 | 89.19 |
| Newark and Sherwood | 138 | 0.72 | 0 | 1.45 | 8.7 | 12.32 | 76.81 | 2.17 | 89.13 |
| Exeter City | 119 | 0 | 1.68 | 3.36 | 5.88 | 19.33 | 69.75 | 5.04 | 89.08 |
| Amber Valley | 182 | 0 | 1.1 | 1.65 | 8.24 | 11.54 | 77.47 | 2.75 | 89.01 |
| Bradford | 445 | 0 | 2.02 | 3.82 | 5.17 | 21.8 | 67.19 | 5.84 | 88.99 |
| Weymouth and Portland | 45 | 0 | 0 | 2.22 | 8.89 | 31.11 | 57.78 | 2.22 | 88.89 |
| Cambridge City | 81 | 0 | 3.7 | 0 | 7.41 | 35.8 | 53.09 | 3.7 | 88.89 |
| Wakefield | 224 | 0.89 | 0.89 | 1.34 | 8.04 | 17.86 | 70.98 | 3.13 | 88.84 |
| Bexley | 125 | 0 | 1.6 | 0 | 9.6 | 42.4 | 46.4 | 1.6 | 88.8 |
| South Gloucestershire | 221 | 0.45 | 1.81 | 1.81 | 7.24 | 15.38 | 73.3 | 4.07 | 88.69 |
| Ashfield | 96 | 0 | 2.08 | 1.04 | 8.33 | 12.5 | 76.04 | 3.13 | 88.54 |
| Redcar and Cleveland | 122 | 0.82 | 0.82 | 2.46 | 7.38 | 14.75 | 73.77 | 4.1 | 88.52 |
| Cheshire West and Chester | 190 | 0 | 2.63 | 0.53 | 8.42 | 24.74 | 63.68 | 3.16 | 88.42 |
| Mendip | 171 | 0 | 2.92 | 1.75 | 7.02 | 19.3 | 69.01 | 4.68 | 88.3 |
| Reading | 111 | 0 | 0.9 | 0.9 | 9.91 | 39.64 | 48.65 | 1.8 | 88.29 |
| Epping Forest | 153 | 0 | 0.65 | 1.31 | 9.8 | 18.3 | 69.93 | 1.96 | 88.24 |
| Purbeck | 59 | 0 | 0 | 3.39 | 8.47 | 16.95 | 71.19 | 3.39 | 88.14 |
| West Devon | 67 | 1.49 | 2.99 | 0 | 7.46 | 31.34 | 56.72 | 4.48 | 88.06 |
| South Ribble | 33 | 0 | 0 | 0 | 12.12 | 39.39 | 48.48 | 0 | 87.88 |
| Barking and Dagenham | 41 | 0 | 2.44 | 2.44 | 7.32 | 51.22 | 36.59 | 4.88 | 87.8 |
| Hyndburn | 82 | 1.22 | 6.1 | 3.66 | 1.22 | 36.59 | 51.22 | 10.98 | 87.8 |
| High Peak | 139 | 0.72 | 2.88 | 0 | 8.63 | 15.83 | 71.94 | 3.6 | 87.77 |
| Stratford-on-Avon | 211 | 0 | 3.32 | 1.42 | 7.58 | 22.27 | 65.4 | 4.74 | 87.68 |
| Fylde | 73 | 0 | 2.74 | 4.11 | 5.48 | 34.25 | 53.42 | 6.85 | 87.67 |
| Halton | 105 | 0.95 | 0.95 | 0.95 | 9.52 | 30.48 | 57.14 | 2.86 | 87.62 |
| West Somerset | 64 | 1.56 | 0 | 4.69 | 6.25 | 21.88 | 65.63 | 6.25 | 87.5 |
| South Northamptonshire | 111 | 0 | 1.8 | 1.8 | 9.01 | 27.03 | 60.36 | 3.6 | 87.39 |
| Newcastle-Under-Lyme | 118 | 0 | 0.85 | 3.39 | 8.47 | 21.19 | 66.1 | 4.24 | 87.29 |
| Bath and North East Somerset | 165 | 0 | 0 | 1.82 | 10.91 | 29.09 | 58.18 | 1.82 | 87.27 |
| Hammersmith and Fulham | 133 | 0 | 0 | 1.5 | 11.28 | 19.55 | 67.67 | 1.5 | 87.22 |
| North East Derbyshire | 125 | 0 | 0.8 | 1.6 | 10.4 | 24.8 | 62.4 | 2.4 | 87.2 |
| North Kesteven | 109 | 0 | 1.83 | 1.83 | 9.17 | 21.1 | 66.06 | 3.67 | 87.16 |
| North West Leicestershire | 108 | 0 | 3.7 | 0 | 9.26 | 29.63 | 57.41 | 3.7 | 87.04 |
| Aylesbury Vale | 185 | 0 | 0.54 | 3.24 | 9.19 | 27.57 | 59.46 | 3.78 | 87.03 |
| Peterborough City | 92 | 0 | 1.09 | 8.7 | 3.26 | 25 | 61.96 | 9.78 | 86.96 |
| Windsor and Maidenhead | 107 | 0 | 1.87 | 4.67 | 6.54 | 39.25 | 47.66 | 6.54 | 86.92 |
| Broadland | 84 | 1.19 | 1.19 | 0 | 10.71 | 16.67 | 70.24 | 2.38 | 86.9 |
| Lancaster City | 168 | 1.19 | 0.6 | 2.38 | 8.93 | 17.26 | 69.64 | 4.17 | 86.9 |
| Gravesham | 91 | 0 | 2.2 | 3.3 | 7.69 | 17.58 | 69.23 | 5.49 | 86.81 |
| Babergh | 97 | 0 | 2.06 | 3.09 | 8.25 | 21.65 | 64.95 | 5.15 | 86.6 |
| Mid Suffolk | 82 | 0 | 1.22 | 6.1 | 6.1 | 24.39 | 62.2 | 7.32 | 86.59 |
| Charnwood | 186 | 0 | 2.69 | 4.3 | 6.45 | 19.89 | 66.67 | 6.99 | 86.56 |
| Wokingham | 89 | 0 | 2.25 | 1.12 | 10.11 | 24.72 | 61.8 | 3.37 | 86.52 |
| Warwick | 111 | 0.9 | 4.5 | 4.5 | 3.6 | 18.92 | 67.57 | 9.91 | 86.49 |
| Oxford City | 140 | 0 | 0.71 | 1.43 | 11.43 | 22.14 | 64.29 | 2.14 | 86.43 |
| Hinckley and Bosworth | 110 | 0 | 1.82 | 0 | 11.82 | 30.91 | 55.45 | 1.82 | 86.36 |
| Brighton and Hove | 307 | 0 | 1.3 | 1.3 | 11.07 | 20.52 | 65.8 | 2.61 | 86.32 |
| Woking | 51 | 0 | 3.92 | 3.92 | 5.88 | 7.84 | 78.43 | 7.84 | 86.27 |
| Kettering | 80 | 0 | 2.5 | 1.25 | 10 | 25 | 61.25 | 3.75 | 86.25 |
| Kensington and Chelsea | 108 | 0 | 0 | 1.85 | 12.04 | 20.37 | 65.74 | 1.85 | 86.11 |
| Burnley | 107 | 0 | 0.93 | 1.87 | 11.21 | 34.58 | 51.4 | 2.8 | 85.98 |
| Gosport | 57 | 0 | 7.02 | 1.75 | 5.26 | 17.54 | 68.42 | 8.77 | 85.96 |
| Manchester | 441 | 0 | 4.54 | 0.23 | 9.3 | 18.59 | 67.35 | 4.76 | 85.94 |
| Ashford | 85 | 1.18 | 2.35 | 1.18 | 9.41 | 24.71 | 61.18 | 4.71 | 85.88 |
| Nuneaton and Bedworth | 106 | 0 | 0.94 | 0.94 | 12.26 | 32.08 | 53.77 | 1.89 | 85.85 |
| Adur | 42 | 0 | 0 | 4.76 | 9.52 | 38.1 | 47.62 | 4.76 | 85.71 |
| Fenland | 84 | 0 | 0 | 4.76 | 9.52 | 21.43 | 64.29 | 4.76 | 85.71 |
| Copeland | 112 | 0 | 2.68 | 2.68 | 8.93 | 26.79 | 58.93 | 5.36 | 85.71 |
| Braintree | 154 | 0 | 2.6 | 1.3 | 10.39 | 22.73 | 62.99 | 3.9 | 85.71 |
| York | 217 | 0 | 4.61 | 0.92 | 8.76 | 26.27 | 59.45 | 5.53 | 85.71 |
| Sheffield | 209 | 0 | 1.91 | 1.91 | 10.53 | 29.19 | 56.46 | 3.83 | 85.65 |
| South Lakeland | 180 | 0 | 0 | 1.11 | 13.33 | 26.11 | 59.44 | 1.11 | 85.56 |
| Stockton On Tees | 145 | 0 | 4.14 | 0.69 | 9.66 | 24.14 | 61.38 | 4.83 | 85.52 |
| Mole Valley | 62 | 0 | 4.84 | 1.61 | 8.06 | 20.97 | 64.52 | 6.45 | 85.48 |
| Swansea | 192 | 0 | 2.08 | 2.08 | 10.42 | 31.25 | 54.17 | 4.17 | 85.42 |
| Carlisle City | 89 | 0 | 1.12 | 3.37 | 10.11 | 15.73 | 69.66 | 4.49 | 85.39 |
| Isle of Wight | 170 | 0.59 | 2.35 | 4.71 | 7.06 | 17.06 | 68.24 | 7.65 | 85.29 |
| Southampton | 176 | 0 | 0 | 0.57 | 14.2 | 27.84 | 57.39 | 0.57 | 85.23 |
| Ipswich | 60 | 1.67 | 5 | 1.67 | 6.67 | 18.33 | 66.67 | 8.33 | 85 |
| Crawley | 53 | 0 | 1.89 | 3.77 | 9.43 | 18.87 | 66.04 | 5.66 | 84.91 |
| Great Yarmouth | 112 | 0.89 | 2.68 | 2.68 | 8.93 | 32.14 | 52.68 | 6.25 | 84.82 |
| Birmingham | 448 | 1.56 | 5.13 | 2.68 | 5.8 | 27.9 | 56.92 | 9.38 | 84.82 |
| Winchester City | 118 | 0.85 | 2.54 | 0 | 11.86 | 21.19 | 63.56 | 3.39 | 84.75 |
| Coventry | 209 | 0 | 0.48 | 3.83 | 11 | 27.27 | 57.42 | 4.31 | 84.69 |
| Newport | 111 | 0 | 4.5 | 4.5 | 6.31 | 27.93 | 56.76 | 9.01 | 84.68 |
| Rugby | 124 | 0 | 2.42 | 1.61 | 11.29 | 29.03 | 55.65 | 4.03 | 84.68 |
| Portsmouth | 189 | 0.53 | 0.53 | 1.59 | 12.7 | 30.16 | 54.5 | 2.65 | 84.66 |
| Mid Sussex | 116 | 0 | 2.59 | 4.31 | 8.62 | 18.1 | 66.38 | 6.9 | 84.48 |
| North Hertfordshire | 148 | 0.68 | 5.41 | 3.38 | 6.08 | 20.95 | 63.51 | 9.46 | 84.46 |
| Gedling | 45 | 0 | 0 | 4.44 | 11.11 | 8.89 | 75.56 | 4.44 | 84.44 |
| Kingston-Upon-Thames | 141 | 0 | 1.42 | 2.84 | 11.35 | 26.95 | 57.45 | 4.26 | 84.4 |
| Cheltenham | 96 | 0 | 3.13 | 0 | 12.5 | 38.54 | 45.83 | 3.13 | 84.38 |
| Dartford | 70 | 0 | 0 | 2.86 | 12.86 | 37.14 | 47.14 | 2.86 | 84.29 |
| Carmarthenshire | 267 | 0 | 0.75 | 1.87 | 13.11 | 36.33 | 47.94 | 2.62 | 84.27 |
| Wyre | 76 | 0 | 3.95 | 1.32 | 10.53 | 35.53 | 48.68 | 5.26 | 84.21 |
| East Lindsey | 176 | 0.57 | 4.55 | 1.7 | 9.09 | 12.5 | 71.59 | 6.82 | 84.09 |
| Shropshire | 375 | 0 | 0.53 | 1.07 | 14.4 | 21.33 | 62.67 | 1.6 | 84 |
| Anglesey | 80 | 0 | 0 | 0 | 16.25 | 47.5 | 36.25 | 0 | 83.75 |
| Rochdale | 166 | 0 | 2.41 | 2.41 | 11.45 | 35.54 | 48.19 | 4.82 | 83.73 |
| Castle Point | 43 | 0 | 11.63 | 0 | 4.65 | 2.33 | 81.4 | 11.63 | 83.72 |
| South Buckinghamshire | 6 | 0 | 16.67 | 0 | 0 | 50 | 33.33 | 16.67 | 83.33 |
| Forest of Dean | 30 | 0 | 0 | 0 | 16.67 | 20 | 63.33 | 0 | 83.33 |
| Fareham | 48 | 0 | 4.17 | 4.17 | 8.33 | 16.67 | 66.67 | 8.33 | 83.33 |
| West Oxfordshire | 108 | 0 | 2.78 | 2.78 | 11.11 | 21.3 | 62.04 | 5.56 | 83.33 |
| South Tyneside | 155 | 0 | 1.94 | 5.16 | 9.68 | 38.06 | 45.16 | 7.1 | 83.23 |
| Breckland | 112 | 0 | 4.46 | 1.79 | 10.71 | 25.89 | 57.14 | 6.25 | 83.04 |
| East Staffordshire | 112 | 0 | 0.89 | 1.79 | 14.29 | 29.46 | 53.57 | 2.68 | 83.04 |
| Wandsworth | 171 | 0 | 1.75 | 4.09 | 11.11 | 19.88 | 63.16 | 5.85 | 83.04 |
| Spelthorne | 53 | 0 | 3.77 | 5.66 | 7.55 | 35.85 | 47.17 | 9.43 | 83.02 |
| City of London Corporation | 247 | 1.62 | 2.43 | 6.07 | 6.88 | 27.13 | 55.87 | 10.12 | 83 |
| Gateshead | 194 | 0 | 0 | 3.61 | 13.4 | 36.08 | 46.91 | 3.61 | 82.99 |
| Guildford | 93 | 0 | 2.15 | 5.38 | 9.68 | 21.51 | 61.29 | 7.53 | 82.8 |
| Hambleton | 121 | 0 | 4.96 | 3.31 | 9.09 | 17.36 | 65.29 | 8.26 | 82.64 |
| Barnet | 137 | 0.73 | 0.73 | 4.38 | 11.68 | 28.47 | 54.01 | 5.84 | 82.48 |
| Mansfield | 97 | 0 | 3.09 | 3.09 | 11.34 | 24.74 | 57.73 | 6.19 | 82.47 |
| Torbay | 91 | 0 | 8.79 | 3.3 | 5.49 | 21.98 | 60.44 | 12.09 | 82.42 |
| Plymouth City | 141 | 0.71 | 4.96 | 2.84 | 9.22 | 21.99 | 60.28 | 8.51 | 82.27 |
| North Norfolk | 124 | 0 | 2.42 | 2.42 | 12.9 | 23.39 | 58.87 | 4.84 | 82.26 |
| Hillingdon | 152 | 0 | 1.97 | 0.66 | 15.13 | 18.42 | 63.82 | 2.63 | 82.24 |
| Worcester City | 56 | 0 | 0 | 1.79 | 16.07 | 23.21 | 58.93 | 1.79 | 82.14 |
| Shepway | 134 | 0 | 0.75 | 2.24 | 14.93 | 20.15 | 61.94 | 2.99 | 82.09 |
| Rushcliffe | 77 | 0 | 5.19 | 1.3 | 11.69 | 22.08 | 59.74 | 6.49 | 81.82 |
| Uttlesford | 77 | 0 | 3.9 | 3.9 | 10.39 | 28.57 | 53.25 | 7.79 | 81.82 |
| Arun | 115 | 0 | 2.61 | 4.35 | 11.3 | 37.39 | 44.35 | 6.96 | 81.74 |
| Cheshire East | 273 | 0.37 | 2.56 | 3.3 | 12.09 | 26.01 | 55.68 | 6.23 | 81.68 |
| Broxtowe | 76 | 0 | 1.32 | 3.95 | 13.16 | 31.58 | 50 | 5.26 | 81.58 |
| Preston | 130 | 0 | 0 | 2.31 | 16.15 | 25.38 | 56.15 | 2.31 | 81.54 |
| Waverley | 92 | 0 | 3.26 | 3.26 | 11.96 | 19.57 | 61.96 | 6.52 | 81.52 |
| East Hertfordshire | 146 | 0 | 3.42 | 7.53 | 7.53 | 41.78 | 39.73 | 10.96 | 81.51 |
| Poole | 54 | 0 | 0 | 0 | 18.52 | 31.48 | 50 | 0 | 81.48 |
| Ryedale | 91 | 0 | 3.3 | 3.3 | 12.09 | 32.97 | 48.35 | 6.59 | 81.32 |
| East Hampshire | 139 | 0 | 1.44 | 2.88 | 14.39 | 29.5 | 51.8 | 4.32 | 81.29 |
| Greenwich | 96 | 0 | 5.21 | 2.08 | 11.46 | 25 | 56.25 | 7.29 | 81.25 |
| Hounslow | 128 | 0 | 5.47 | 2.34 | 10.94 | 25 | 56.25 | 7.81 | 81.25 |
| Lichfield | 128 | 0.78 | 3.13 | 0 | 14.84 | 25.78 | 55.47 | 3.91 | 81.25 |
| Richmond-Upon-Thames | 160 | 0.63 | 1.25 | 1.25 | 15.63 | 29.38 | 51.88 | 3.13 | 81.25 |
| Huntingdonshire | 126 | 0 | 2.38 | 3.17 | 13.49 | 23.02 | 57.94 | 5.56 | 80.95 |
| Norwich City | 152 | 0 | 1.97 | 0 | 17.11 | 46.05 | 34.87 | 1.97 | 80.92 |
| South Hams | 115 | 0.87 | 0 | 2.61 | 15.65 | 23.48 | 57.39 | 3.48 | 80.87 |
| Powys | 307 | 0.33 | 3.58 | 4.56 | 10.75 | 35.18 | 45.6 | 8.47 | 80.78 |
| Kirklees | 560 | 0.18 | 2.14 | 2.68 | 14.29 | 32.5 | 48.21 | 5 | 80.71 |
| Bromsgrove | 67 | 0 | 0 | 0 | 19.4 | 22.39 | 58.21 | 0 | 80.6 |
| South Staffordshire | 113 | 0 | 5.31 | 0 | 14.16 | 35.4 | 45.13 | 5.31 | 80.53 |
| Liverpool | 498 | 0.4 | 2.41 | 3.21 | 13.45 | 27.11 | 53.41 | 6.02 | 80.52 |
| Blackburn | 123 | 0 | 1.63 | 2.44 | 15.45 | 29.27 | 51.22 | 4.07 | 80.49 |
| Chelmsford | 138 | 0.72 | 0.72 | 3.62 | 14.49 | 15.94 | 64.49 | 5.07 | 80.43 |
| East Cambridgeshire | 51 | 0 | 3.92 | 5.88 | 9.8 | 27.45 | 52.94 | 9.8 | 80.39 |
| Stroud | 117 | 0 | 0 | 5.13 | 14.53 | 26.5 | 53.85 | 5.13 | 80.34 |
| Rotherham | 216 | 0 | 10.19 | 1.85 | 7.87 | 23.61 | 56.48 | 12.04 | 80.09 |
| Melton | 55 | 0 | 1.82 | 7.27 | 10.91 | 25.45 | 54.55 | 9.09 | 80 |
| North Dorset | 65 | 0 | 1.54 | 1.54 | 16.92 | 23.08 | 56.92 | 3.08 | 80 |
| Solihull | 120 | 0 | 5.83 | 1.67 | 12.5 | 26.67 | 53.33 | 7.5 | 80 |
| Stoke-On-Trent | 245 | 0 | 1.63 | 1.63 | 16.73 | 25.71 | 54.29 | 3.27 | 80 |
| Cardiff | 208 | 0 | 3.37 | 2.88 | 13.94 | 26.44 | 53.37 | 6.25 | 79.81 |
| South Somerset | 203 | 0 | 0.99 | 2.96 | 16.26 | 22.66 | 57.14 | 3.94 | 79.8 |
| Neath Port Talbot | 168 | 0.6 | 2.38 | 4.17 | 13.1 | 36.31 | 43.45 | 7.14 | 79.76 |
| Oldham | 259 | 0 | 1.16 | 1.16 | 18.15 | 32.05 | 47.49 | 2.32 | 79.54 |
| Test Valley | 117 | 0 | 7.69 | 3.42 | 9.4 | 17.95 | 61.54 | 11.11 | 79.49 |
| Bracknell Forest | 68 | 0 | 2.94 | 5.88 | 11.76 | 23.53 | 55.88 | 8.82 | 79.41 |
| Tamworth | 63 | 1.59 | 9.52 | 0 | 9.52 | 15.87 | 63.49 | 11.11 | 79.37 |
| Dover | 153 | 0.65 | 2.61 | 0.65 | 16.99 | 27.45 | 51.63 | 3.92 | 79.08 |
| Cornwall | 583 | 0 | 2.06 | 3.26 | 15.61 | 23.84 | 55.23 | 5.32 | 79.07 |
| Wellingborough | 81 | 0 | 6.17 | 1.23 | 13.58 | 24.69 | 54.32 | 7.41 | 79.01 |
| Stafford | 147 | 0 | 2.72 | 2.72 | 15.65 | 27.89 | 51.02 | 5.44 | 78.91 |
| Waltham Forest | 90 | 1.11 | 0 | 4.44 | 15.56 | 28.89 | 50 | 5.56 | 78.89 |
| Wirral | 222 | 0 | 2.7 | 2.7 | 15.77 | 33.33 | 45.5 | 5.41 | 78.83 |
| Herefordshire | 221 | 0 | 1.36 | 4.07 | 15.84 | 35.29 | 43.44 | 5.43 | 78.73 |
| Enfield | 169 | 0 | 5.92 | 1.78 | 13.61 | 29.59 | 49.11 | 7.69 | 78.7 |
| Cherwell | 117 | 0 | 5.13 | 3.42 | 12.82 | 24.79 | 53.85 | 8.55 | 78.63 |
| Rother | 115 | 0 | 0 | 0.87 | 20.87 | 20.87 | 57.39 | 0.87 | 78.26 |
| Calderdale | 343 | 0.29 | 2.04 | 3.21 | 16.33 | 41.4 | 36.73 | 5.54 | 78.13 |
| Lambeth | 168 | 0 | 4.76 | 1.19 | 16.07 | 27.98 | 50 | 5.95 | 77.98 |
| Blackpool | 63 | 0 | 3.17 | 1.59 | 17.46 | 22.22 | 55.56 | 4.76 | 77.78 |
| Ceredigion | 126 | 0 | 5.56 | 3.97 | 12.7 | 24.6 | 53.17 | 9.52 | 77.78 |
| Westminster | 399 | 0.25 | 3.01 | 10.53 | 8.52 | 26.32 | 51.38 | 13.78 | 77.69 |
| Knowsley | 58 | 0 | 0 | 1.72 | 20.69 | 25.86 | 51.72 | 1.72 | 77.59 |
| Southend-On-Sea | 89 | 0 | 2.25 | 3.37 | 16.85 | 26.97 | 50.56 | 5.62 | 77.53 |
| Merton | 84 | 0 | 2.38 | 2.38 | 17.86 | 44.05 | 33.33 | 4.76 | 77.38 |
| Blaenau Gwent | 110 | 0.91 | 6.36 | 4.55 | 10.91 | 26.36 | 50.91 | 11.82 | 77.27 |
| Tonbridge and Malling | 101 | 0 | 2.97 | 2.97 | 16.83 | 38.61 | 38.61 | 5.94 | 77.23 |
|
King's Lynn and West Norfolk
|
180 | 0 | 4.44 | 4.44 | 13.89 | 25 | 52.22 | 8.89 | 77.22 |
| Worthing | 74 | 0 | 2.7 | 2.7 | 17.57 | 12.16 | 64.86 | 5.41 | 77.03 |
| Hart | 52 | 0 | 1.92 | 0 | 21.15 | 36.54 | 40.38 | 1.92 | 76.92 |
| South Holland | 78 | 0 | 1.28 | 0 | 21.79 | 35.9 | 41.03 | 1.28 | 76.92 |
| Lewes | 82 | 1.22 | 7.32 | 2.44 | 12.2 | 14.63 | 62.2 | 10.98 | 76.83 |
| Christchurch | 30 | 0 | 3.33 | 3.33 | 16.67 | 23.33 | 53.33 | 6.67 | 76.67 |
| Trafford | 137 | 0 | 2.19 | 5.84 | 15.33 | 14.6 | 62.04 | 8.03 | 76.64 |
| Taunton Deane | 97 | 0 | 4.12 | 7.22 | 12.37 | 22.68 | 53.61 | 11.34 | 76.29 |
| Merthyr Tydfil | 80 | 0 | 8.75 | 3.75 | 11.25 | 37.5 | 38.75 | 12.5 | 76.25 |
| Wealden | 171 | 0 | 1.17 | 5.85 | 16.96 | 28.07 | 47.95 | 7.02 | 76.02 |
| Redditch | 25 | 0 | 4 | 0 | 20 | 36 | 40 | 4 | 76 |
| Luton | 50 | 0 | 0 | 6 | 18 | 24 | 52 | 6 | 76 |
| Wiltshire | 548 | 0.36 | 4.01 | 5.11 | 14.78 | 20.07 | 55.66 | 9.49 | 75.73 |
| Stockport | 74 | 0 | 6.76 | 0 | 17.57 | 24.32 | 51.35 | 6.76 | 75.68 |
| Hertsmere | 45 | 0 | 0 | 8.89 | 15.56 | 35.56 | 40 | 8.89 | 75.56 |
| Malvern Hills | 73 | 0 | 1.37 | 0 | 23.29 | 20.55 | 54.79 | 1.37 | 75.34 |
| Central Bedfordshire | 190 | 0 | 0.53 | 3.68 | 20.53 | 31.05 | 44.21 | 4.21 | 75.26 |
| Monmouthshire | 129 | 0.78 | 1.55 | 6.2 | 16.28 | 30.23 | 44.96 | 8.53 | 75.19 |
| Southwark | 197 | 0.51 | 1.02 | 6.6 | 16.75 | 31.47 | 43.65 | 8.12 | 75.13 |
| North Tyneside | 24 | 0 | 0 | 12.5 | 12.5 | 12.5 | 62.5 | 12.5 | 75 |
| Brent | 104 | 0 | 2.88 | 5.77 | 16.35 | 37.5 | 37.5 | 8.65 | 75 |
| Horsham | 108 | 0 | 3.7 | 6.48 | 14.81 | 33.33 | 41.67 | 10.19 | 75 |
| West Berkshire | 128 | 0 | 4.69 | 2.34 | 17.97 | 23.44 | 51.56 | 7.03 | 75 |
| East Riding of Yorkshire | 426 | 0.47 | 2.35 | 3.29 | 19.01 | 26.29 | 48.59 | 6.1 | 74.88 |
| Allerdale | 83 | 1.2 | 3.61 | 2.41 | 18.07 | 31.33 | 43.37 | 7.23 | 74.7 |
| Rhondda Cynon Taf | 310 | 0.32 | 1.61 | 3.55 | 20 | 44.52 | 30 | 5.48 | 74.52 |
| New Forest | 170 | 0 | 4.71 | 2.35 | 18.82 | 27.65 | 46.47 | 7.06 | 74.12 |
| St Albans City | 112 | 0 | 2.68 | 2.68 | 20.54 | 25.89 | 48.21 | 5.36 | 74.11 |
| Canterbury City | 173 | 0 | 0.58 | 0.58 | 24.86 | 23.7 | 50.29 | 1.16 | 73.99 |
| West Lindsey | 92 | 1.09 | 5.43 | 0 | 19.57 | 26.09 | 47.83 | 6.52 | 73.91 |
| Bridgend | 168 | 0 | 2.38 | 2.98 | 20.83 | 41.67 | 32.14 | 5.36 | 73.81 |
| Doncaster | 311 | 0.64 | 5.14 | 5.79 | 14.79 | 27.01 | 46.62 | 11.58 | 73.63 |
| Telford and Wrekin Council | 117 | 0 | 4.27 | 8.55 | 13.68 | 22.22 | 51.28 | 12.82 | 73.5 |
| Dacorum | 128 | 0 | 6.25 | 2.34 | 17.97 | 15.63 | 57.81 | 8.59 | 73.44 |
| Tameside | 188 | 0 | 0.53 | 1.6 | 24.47 | 24.47 | 48.94 | 2.13 | 73.4 |
| East Devon | 165 | 0 | 0.61 | 5.45 | 20.61 | 31.52 | 41.82 | 6.06 | 73.33 |
| Ealing | 146 | 1.37 | 5.48 | 2.05 | 17.81 | 22.6 | 50.68 | 8.9 | 73.29 |
| West Lancashire | 116 | 0 | 1.72 | 1.72 | 23.28 | 25.86 | 47.41 | 3.45 | 73.28 |
| North Somerset | 134 | 0.75 | 2.99 | 4.48 | 18.66 | 23.13 | 50 | 8.21 | 73.13 |
| North Lincolnshire | 141 | 0.71 | 2.13 | 7.8 | 16.31 | 29.79 | 43.26 | 10.64 | 73.05 |
| Swindon | 141 | 0 | 4.96 | 4.26 | 17.73 | 33.33 | 39.72 | 9.22 | 73.05 |
| Leicester City | 185 | 0.54 | 3.78 | 4.86 | 17.84 | 30.27 | 42.7 | 9.19 | 72.97 |
| Welwyn Hatfield | 59 | 0 | 3.39 | 8.47 | 15.25 | 32.2 | 40.68 | 11.86 | 72.88 |
| Selby | 55 | 0 | 3.64 | 3.64 | 20 | 27.27 | 45.45 | 7.27 | 72.73 |
| Three Rivers | 55 | 0 | 1.82 | 1.82 | 23.64 | 27.27 | 45.45 | 3.64 | 72.73 |
| Staffordshire Moorlands | 120 | 0 | 3.33 | 1.67 | 22.5 | 25.83 | 46.67 | 5 | 72.5 |
| Derbyshire Dales | 160 | 0.63 | 5.63 | 2.5 | 18.75 | 29.38 | 43.13 | 8.75 | 72.5 |
| Epsom and Ewell | 21 | 0 | 9.52 | 9.52 | 9.52 | 14.29 | 57.14 | 19.05 | 71.43 |
| South Oxfordshire | 66 | 0 | 4.55 | 4.55 | 19.7 | 25.76 | 45.45 | 9.09 | 71.21 |
| Northampton | 144 | 0 | 2.78 | 3.47 | 22.92 | 31.25 | 39.58 | 6.25 | 70.83 |
| Tandridge | 85 | 0 | 0 | 4.71 | 24.71 | 32.94 | 37.65 | 4.71 | 70.59 |
| Croydon | 136 | 0 | 9.56 | 1.47 | 18.38 | 24.26 | 46.32 | 11.03 | 70.59 |
| Wyre Forest | 71 | 0 | 0 | 0 | 29.58 | 26.76 | 43.66 | 0 | 70.42 |
| Wycombe | 151 | 1.32 | 5.3 | 5.3 | 17.88 | 24.5 | 45.7 | 11.92 | 70.2 |
| Lewisham | 57 | 0 | 0 | 7.02 | 22.81 | 15.79 | 54.39 | 7.02 | 70.18 |
| Chiltern | 33 | 0 | 6.06 | 3.03 | 21.21 | 33.33 | 36.36 | 9.09 | 69.7 |
| Wychavon | 88 | 0 | 0 | 2.27 | 28.41 | 26.14 | 43.18 | 2.27 | 69.32 |
| Walsall | 202 | 0 | 3.47 | 7.92 | 19.31 | 39.6 | 29.7 | 11.39 | 69.31 |
| Bolton | 237 | 0 | 2.53 | 7.17 | 21.1 | 41.35 | 27.85 | 9.7 | 69.2 |
| Torfaen | 98 | 0 | 6.12 | 3.06 | 22.45 | 44.9 | 23.47 | 9.18 | 68.37 |
| Camden | 277 | 0 | 3.25 | 5.42 | 23.1 | 30.32 | 37.91 | 8.66 | 68.23 |
| Sutton | 44 | 0 | 0 | 2.27 | 29.55 | 13.64 | 54.55 | 2.27 | 68.18 |
| Havering | 91 | 0 | 13.19 | 5.49 | 13.19 | 29.67 | 38.46 | 18.68 | 68.13 |
| Vale of White Horse | 137 | 0.73 | 0.73 | 11.68 | 18.98 | 24.09 | 43.8 | 13.14 | 67.88 |
| Slough | 28 | 0 | 3.57 | 0 | 28.57 | 17.86 | 50 | 3.57 | 67.86 |
| Hull City | 173 | 0 | 4.05 | 6.94 | 21.39 | 21.97 | 45.66 | 10.98 | 67.63 |
| Sunderland | 258 | 0 | 0 | 0.39 | 32.17 | 24.03 | 43.41 | 0.39 | 67.44 |
| North Warwickshire | 104 | 0 | 0.96 | 10.58 | 21.15 | 34.62 | 32.69 | 11.54 | 67.31 |
| St Helens | 167 | 0.6 | 1.2 | 10.78 | 20.96 | 40.12 | 26.35 | 12.57 | 66.47 |
| Vale of Glamorgan | 135 | 0.74 | 4.44 | 11.85 | 17.04 | 26.67 | 39.26 | 17.04 | 65.93 |
| Cotswold | 117 | 0.85 | 1.71 | 7.69 | 23.93 | 33.33 | 32.48 | 10.26 | 65.81 |
| Bromley | 190 | 0 | 3.68 | 3.16 | 27.37 | 30.53 | 35.26 | 6.84 | 65.79 |
| Runnymede | 61 | 0 | 1.64 | 13.11 | 19.67 | 19.67 | 45.9 | 14.75 | 65.57 |
| Dudley | 305 | 0.33 | 4.59 | 3.28 | 26.56 | 39.02 | 26.23 | 8.2 | 65.25 |
| Rushmoor | 57 | 0 | 8.77 | 7.02 | 19.3 | 17.54 | 47.37 | 15.79 | 64.91 |
| Caerphilly | 213 | 0 | 3.76 | 2.82 | 28.64 | 36.15 | 28.64 | 6.57 | 64.79 |
| Tewkesbury | 43 | 2.33 | 2.33 | 6.98 | 25.58 | 32.56 | 30.23 | 11.63 | 62.79 |
| Isles of Scilly | 8 | 0 | 0 | 0 | 37.5 | 25 | 37.5 | 0 | 62.5 |
| Sevenoaks | 103 | 0 | 7.77 | 3.88 | 26.21 | 26.21 | 35.92 | 11.65 | 62.14 |
| Blaby | 57 | 0 | 1.75 | 5.26 | 31.58 | 12.28 | 49.12 | 7.02 | 61.4 |
| Newham | 47 | 4.26 | 8.51 | 6.38 | 21.28 | 21.28 | 38.3 | 19.15 | 59.57 |
| Harrow | 84 | 0 | 5.95 | 3.57 | 30.95 | 29.76 | 29.76 | 9.52 | 59.52 |
| Sandwell | 236 | 0 | 1.69 | 4.24 | 36.44 | 26.27 | 31.36 | 5.93 | 57.63 |
| Islington | 189 | 1.06 | 5.29 | 12.17 | 26.98 | 24.87 | 29.63 | 18.52 | 54.5 |
| Hackney | 196 | 0 | 3.06 | 7.65 | 38.78 | 25.51 | 25 | 10.71 | 50.51 |
| Wigan | 194 | 0 | 0 | 3.09 | 54.64 | 26.8 | 15.46 | 3.09 | 42.27 |